
Median Efficiency Ratios per State
Sat Feb 14, 2009So, inkeeping with our last post, take a look at the following image. This image shows, both as a map and in a table, the median efficiency ratio for banks located in each state in the US.
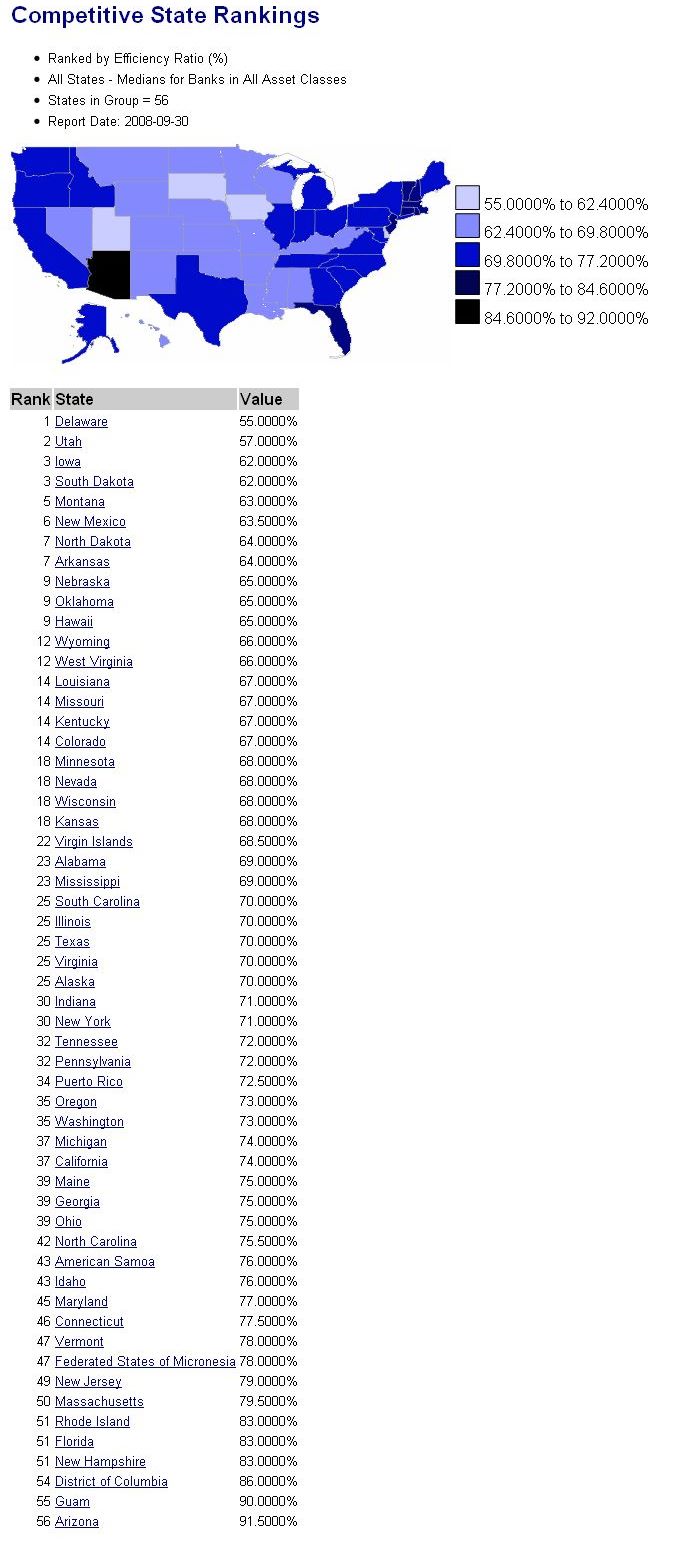
Several folks have asked us about the effects of culture on banking conventions and targets. Obviously, without any statement about the number of banks in each state, and the objectives of those banks, it is not obvious how each number is derived, but this map still provides for some interesting fodder.