
Alabama MSAs by Household Income
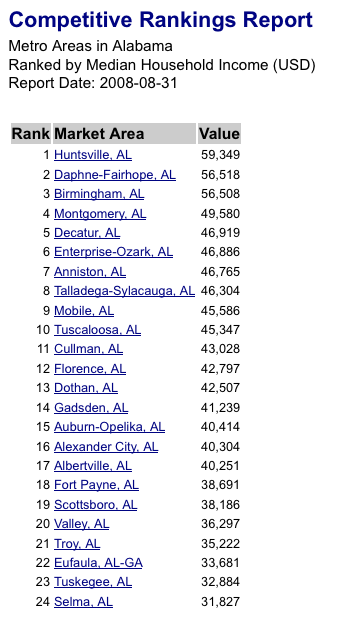
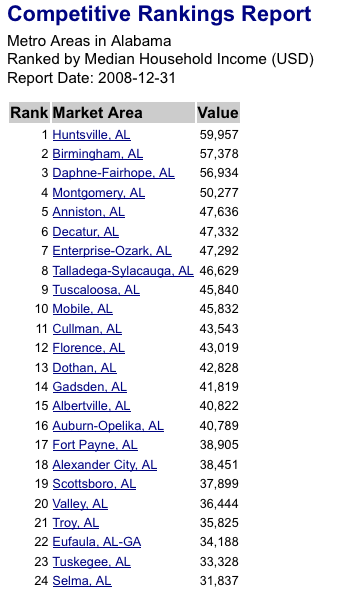
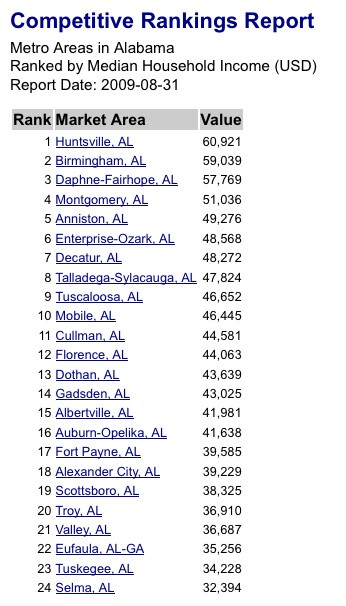
Sat Dec 12, 2009The following tables show the Household Income for MSAs in the state of Alabama at the end of August 2008, December 2008, and August 2009. Over the past year, these tables show an average increase in the number of households of 0.895% per MSA, and an average increase in the median household income of 3.29% per MSA. (Since the start of 2009, we see an average increase in the number of households of 0.59% and an average increase in the median household income of 2.16% per MSA.) Growth over the year has varied from 1.7% in Scottsboro; 2.0% in Mobile; and 1.0% in Valley, to over 4% in Birmingham (4.4%); Anniston (5.5%); Enterprise-Ozark (4.1%); Gadsden (4.4%); Albertville (4.3%); Troy (4.6%); Eufala (4.7%); and Tuskegee (4.1%). Notice that the aggregation of these urban areas showed a cumulative increase in the number of households between August 2008 to August 2009 from 1.896M to 1.916M households (an increase of 1.08%). Interestingly, while all of the noted MSAs showed positive growth over the period, the state of Alabama showed an overall increase in the number of households by just under 1% (from 2.163M to 2.182M) and a decline in its average annual household income from $36939 to $36496, a drop of 1.2%. Also, it should be noted that the consumer price index went from 218.783 at the end of August 2008, to 211.143 at year-end 2008, to 215.969 at the end of August 2009.
The following table lists the MSAs in Alabama, sorted by estimated Household Income as of August 2008, year-end 2008, and August 2009.
 |
 |
 |