
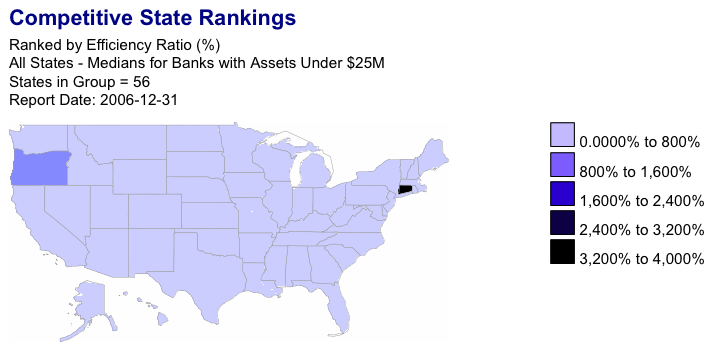
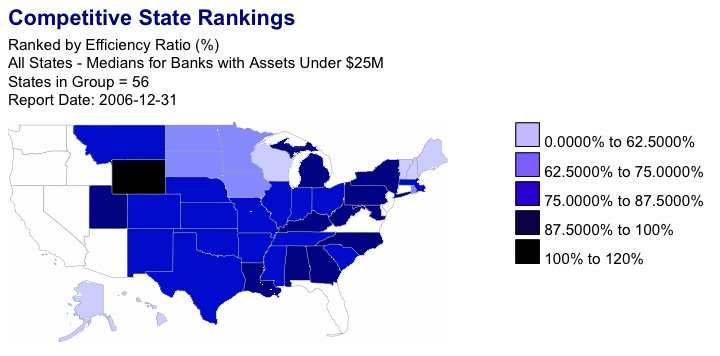
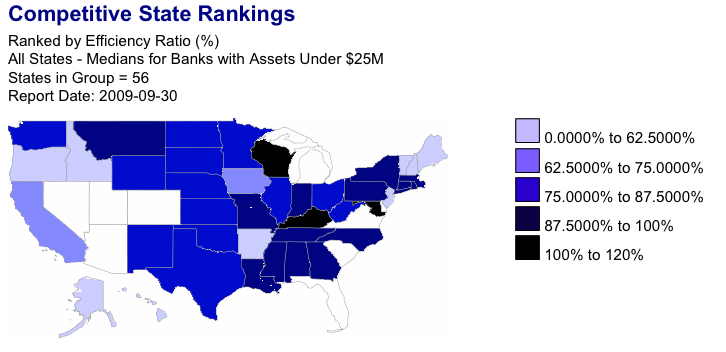
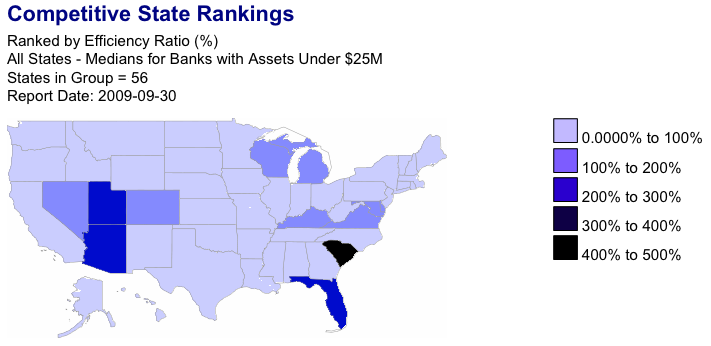
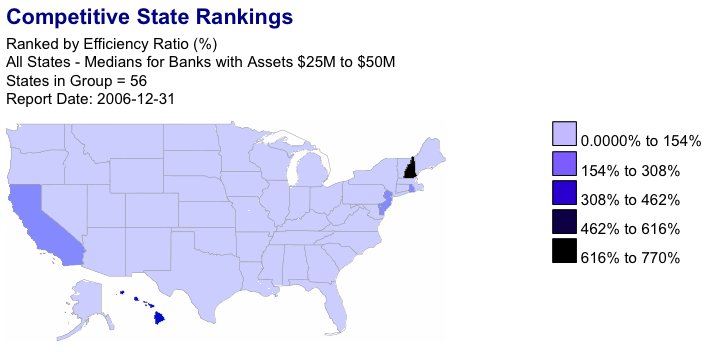
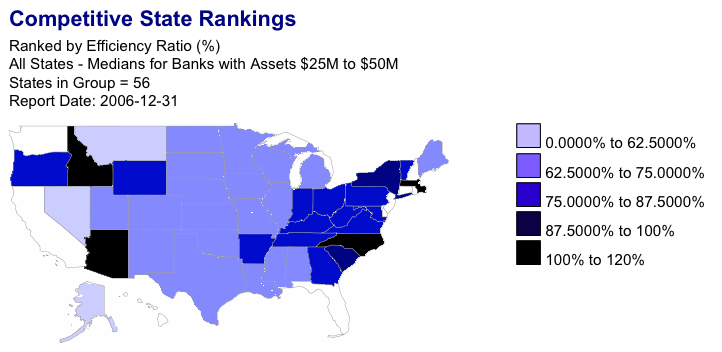
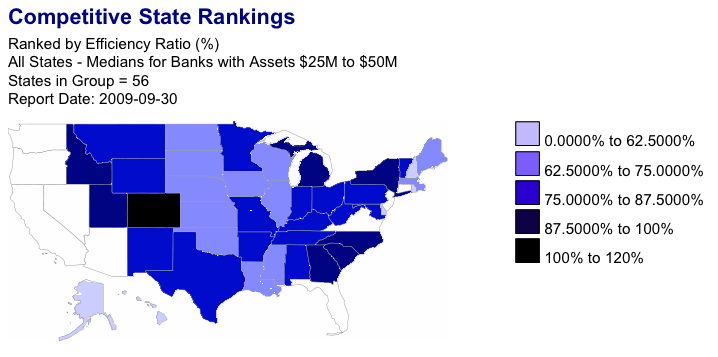
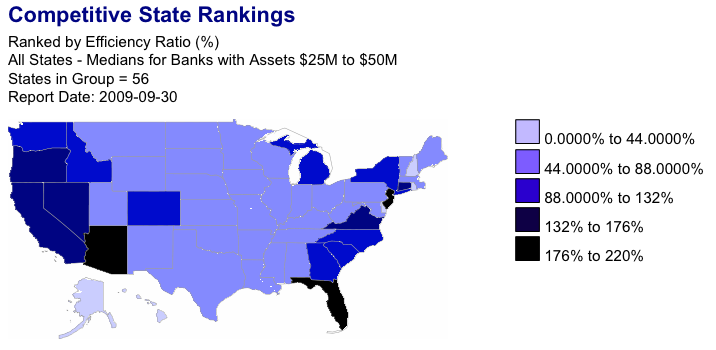
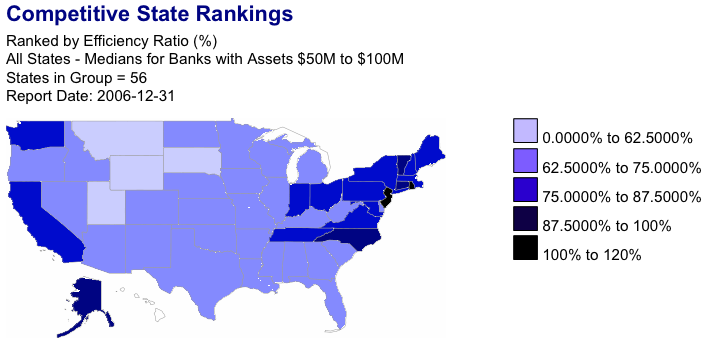
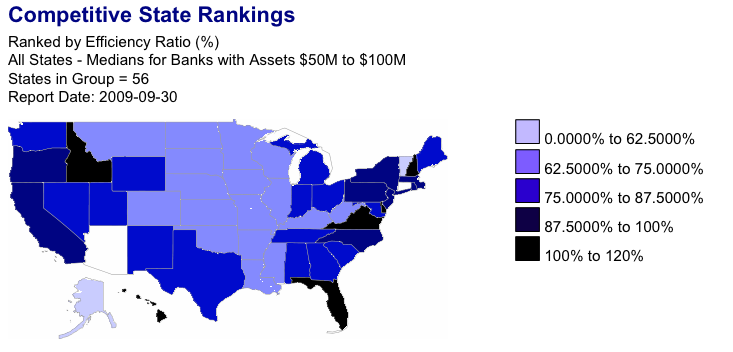
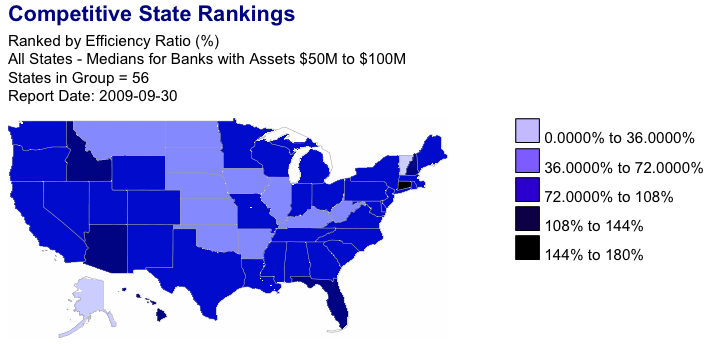
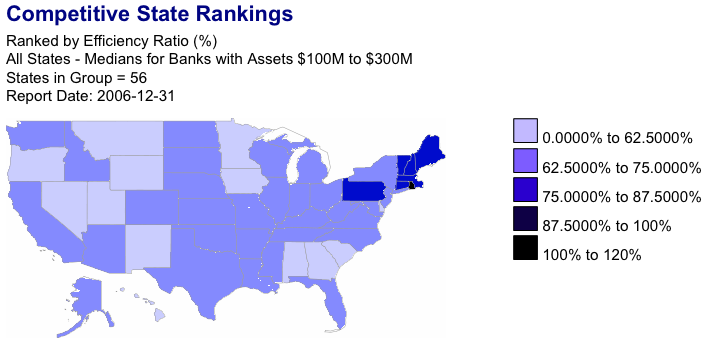
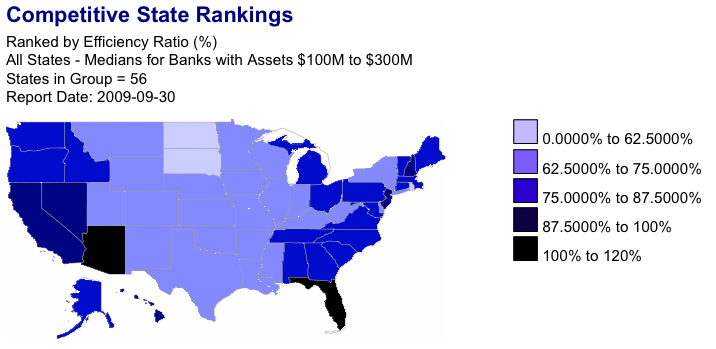
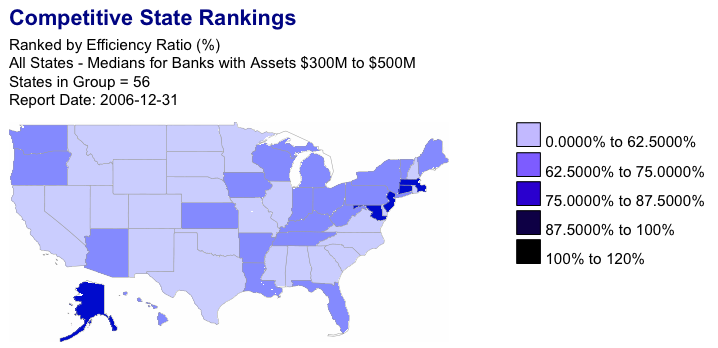
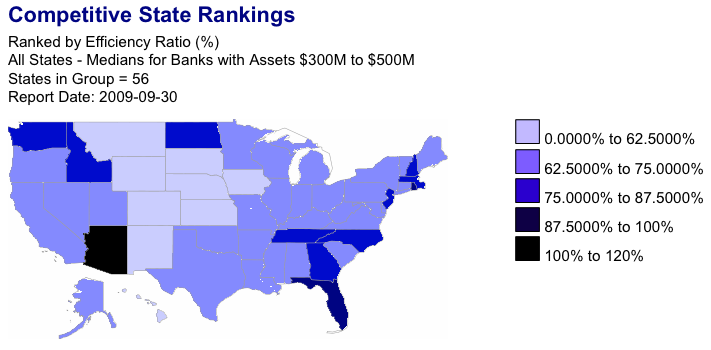
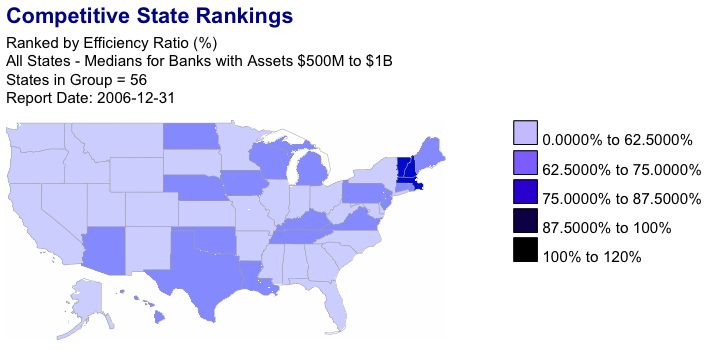
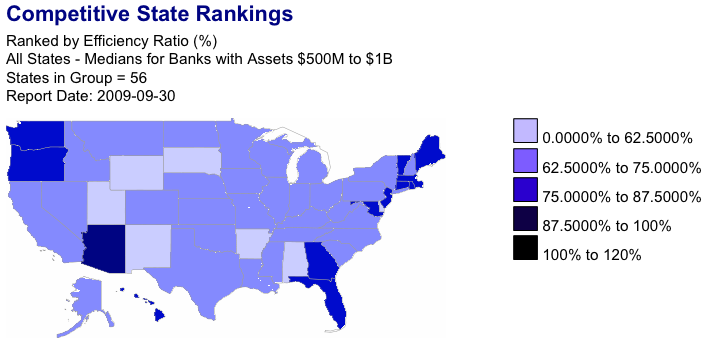
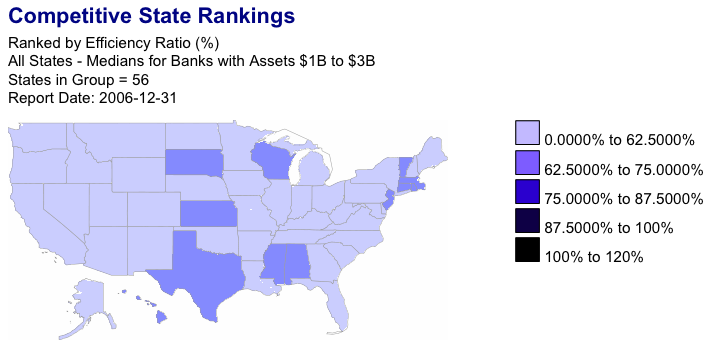
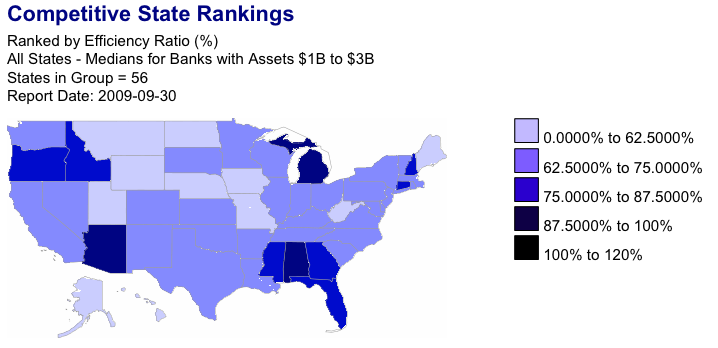
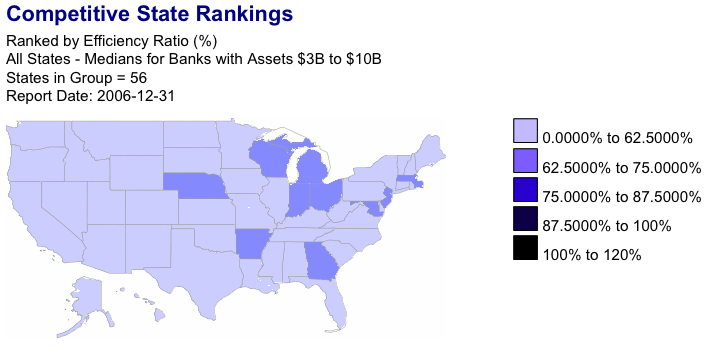
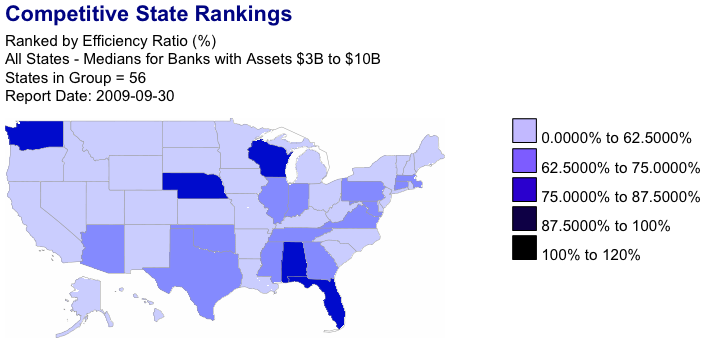
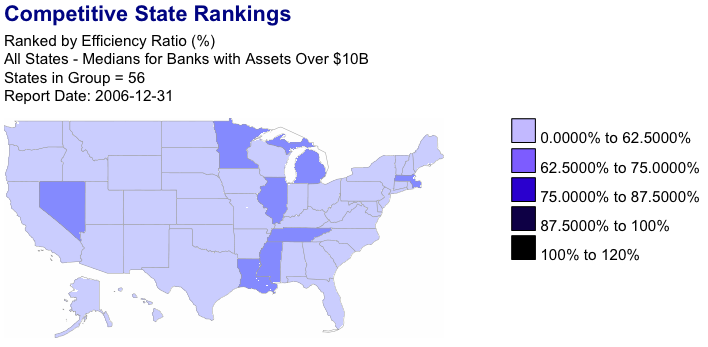
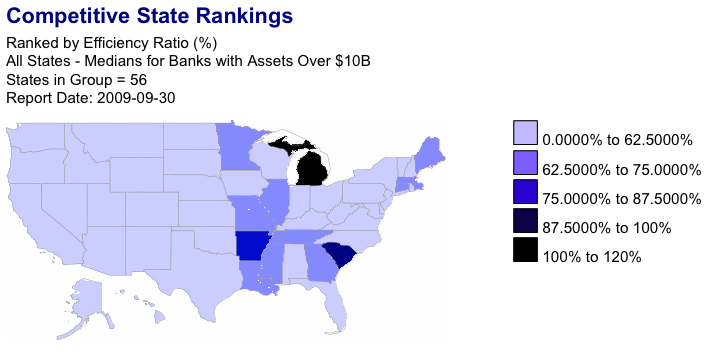
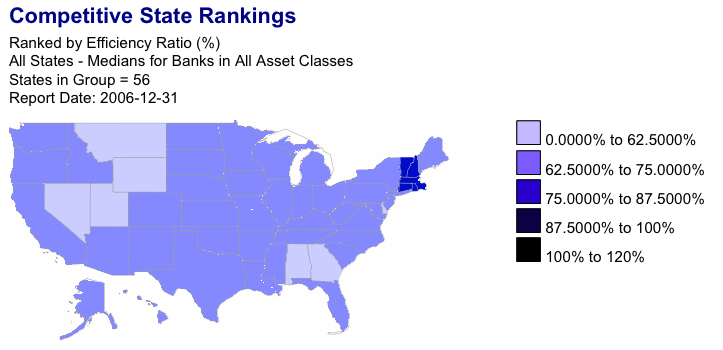
Median Efficiency Ratios per Asset Class
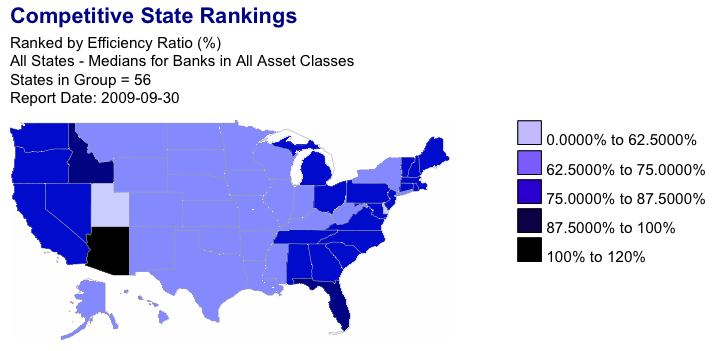
Sat Dec 19, 2009In a previous post, we highlighted the Median Efficiency Ratio across states in the US, and how those values have unfolded over the past 8 quarters. Using the data available for Q4 of 2006 and Q3 of 2009, we present the Median Efficiency Ratio for each of the shown Asset Classes below. Notice that, in some of the diagrams, states are shown in white and have values that are outside of the identified ranges; secondary diagrams are provided on the far left and right to illustrate those states' values.
 |  |  |  |
 |  |  |  |
 |  |  | |
 |  | ||
 |  | ||
 |  | ||
 |  | ||
 |  | ||
 |  | ||
 |  |