Following up on Alabama MSAs by Household Income
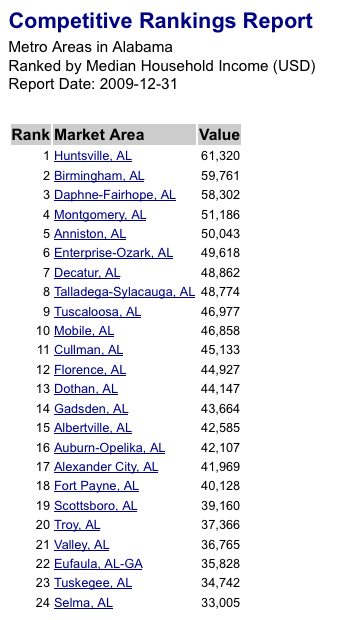
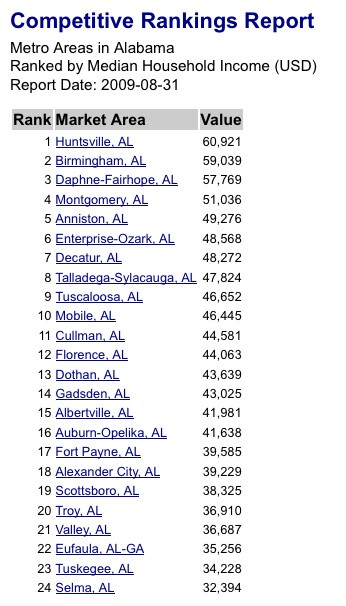
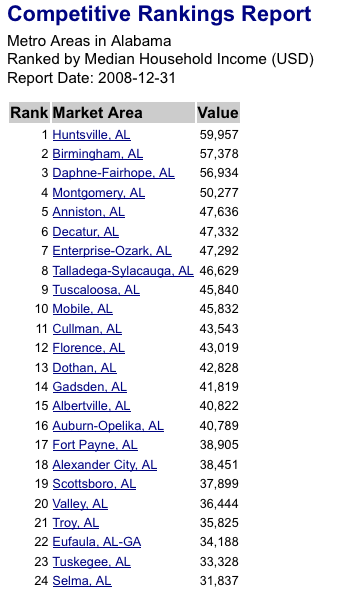
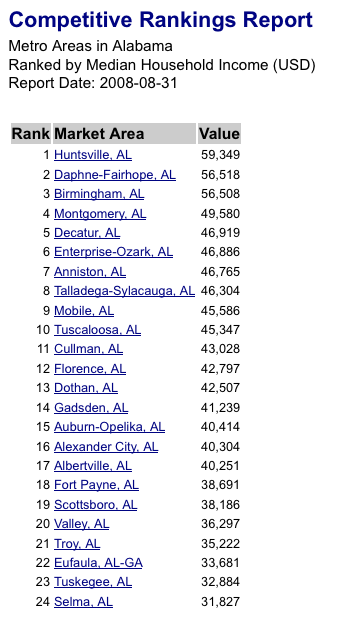
Fri Mar 26, 2010Inkeeping with our previous series, the following tables show the Household Income for MSAs in the state of Alabama at the end of August 2008, December 2008, August 2009, and now December 2009 (shown in the opposite order below). During 2009, we saw an average increase in the number of households of 0.872% per MSA, and an average increase in the median household income of 3.20% per MSA. Growth over the year has varied from 0.96% in Valley; and 1.87% in Scottsboro; to over 4% in Tuskegee (4.01%); Birmingham (4.1%); Albertville (4.1%); Enterprise-Ozark (4.1%); Gadsden (4.2%); Troy (4.3%); Eufala (4.5%); and Anniston (4.9%). Notice that the overall annualized rate from August-to-August is slightly higher than December-to-December, indicating a slow-down in progress in the latter portion of 2009 as compared to late 2008. Also, it should be noted that the consumer price index went from 218.783 at the end of August 2008, to 211.143 at year-end 2008, to 215.969 at the end of August 2009, and 216.687 at year-end 2009 (an increase of 2.63% during 2009).
The following table lists the MSAs in Alabama, sorted by estimated Household Income as of year-end 2009, August 2009, year-end 2008, and August 2008.
 |
 |
 |
 |
