Capitalytics Universal Dashboard
Thu Mar 28, 2013As some of our users have noticed, Capitalytics' dashboard has undergone some changes -- both on the inside and the outside. On the inside, the dashboard has been redesigned from the ground up to improve its performance as well as its ability to be customized on a per-bank and per-user basis. These improvements allow for banks to be able to assemble a unique set of panels to direct their production officers on which instruments are objectives of growth for based on the bank's strategy, while still allowing the C-level officers of the bank to maintain their high-level view of issues within the bank. This improvement in functionality and scalability is what gave rise to re-branding this central access point as the "Capitalytics Universal Dashboard".
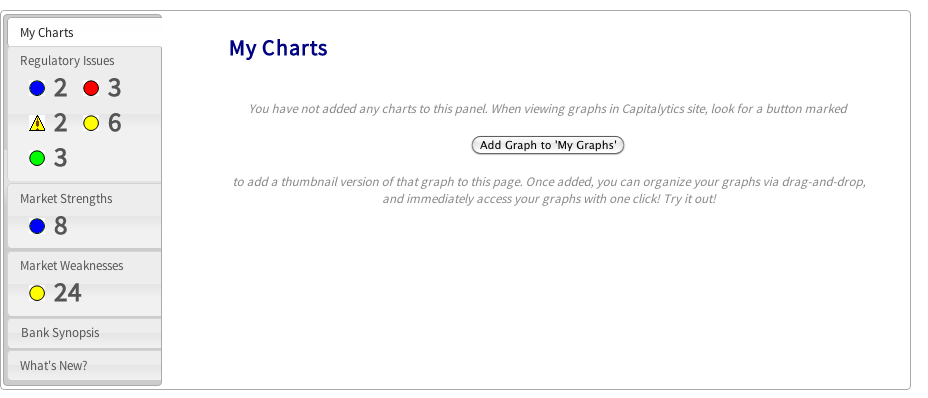
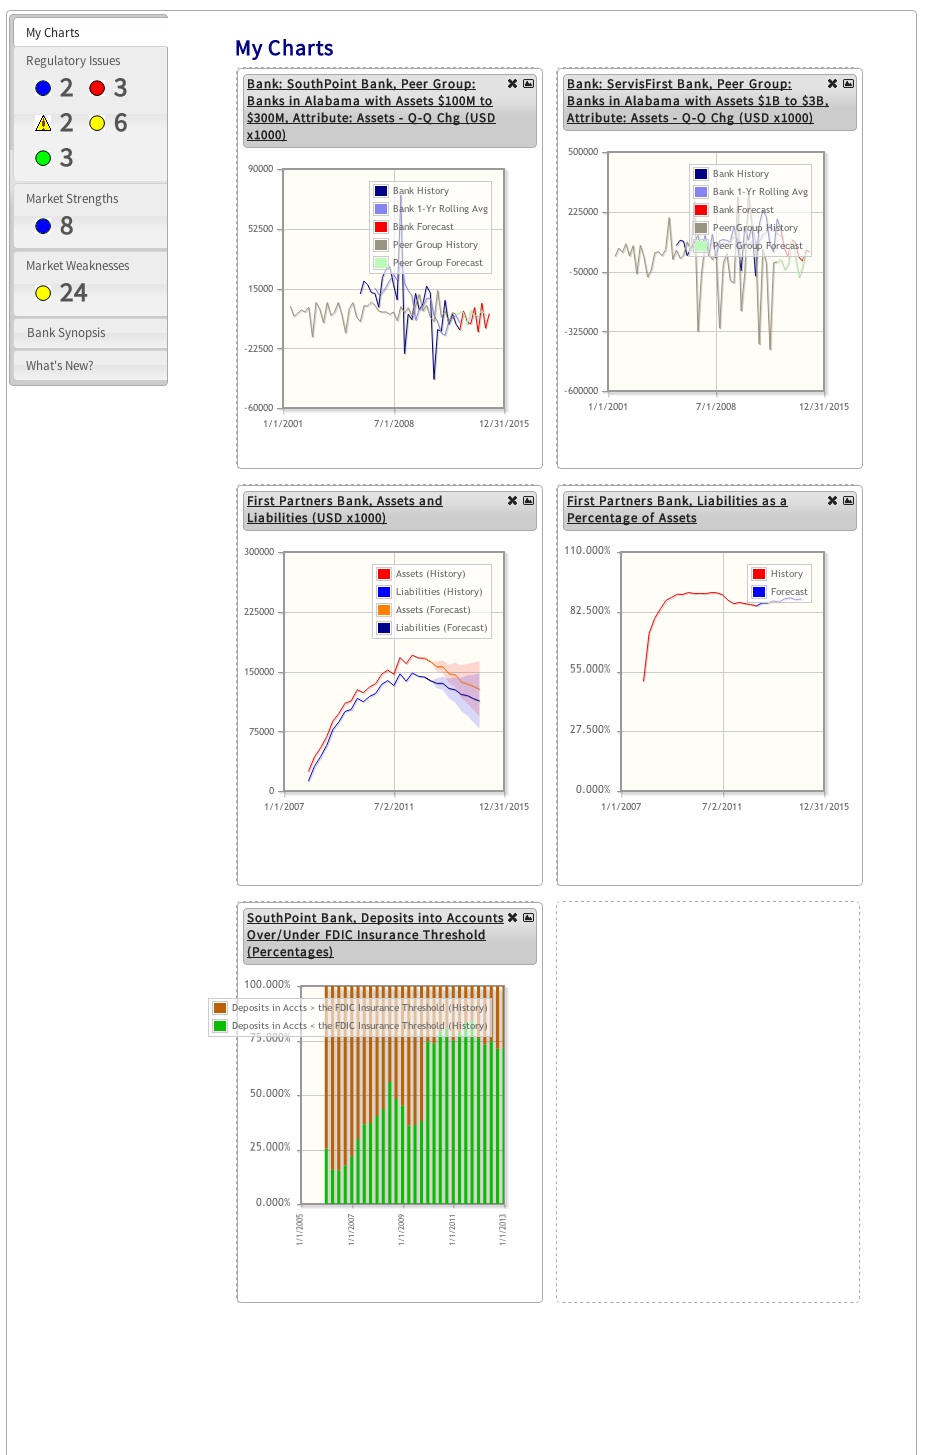
Inside the dashboard, we have also released a newly available panel called "My Graphs". This panel is immediately available when you log in to our system, and provides thumbnails of charts of interest that can be selected from anywhere else within the system. From this panel, you can re-arrange reports by dragging the title bars about the page, and view the pages from which the reports were selected by clicking on the title of a chart.
Contact us today to talk about how we can help you maintain the flow of information within your bank!