
Mississippi and Georgia MSAs by Median Household Income
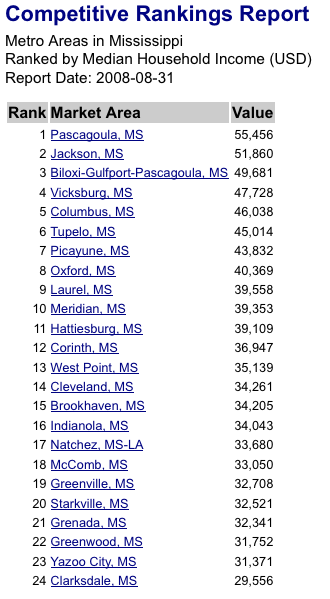
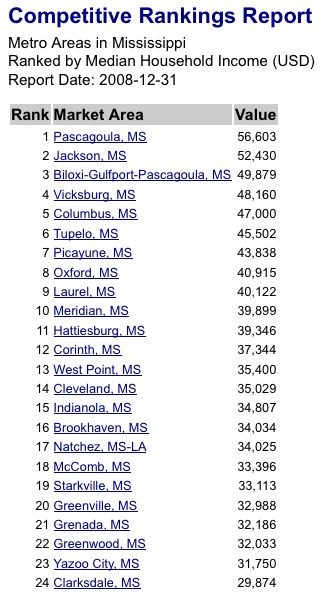
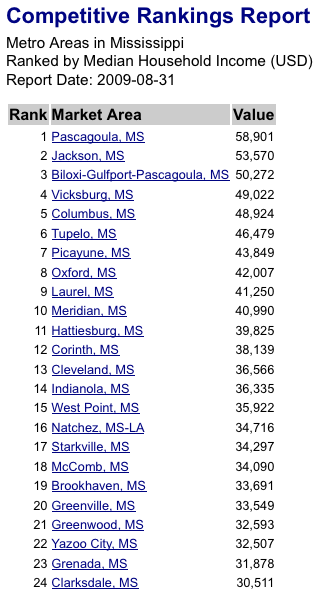
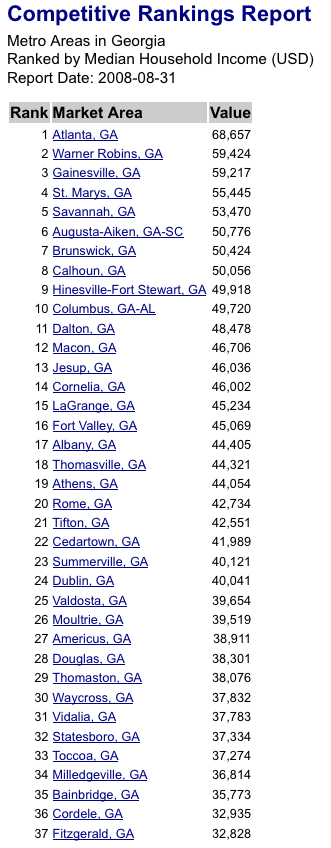
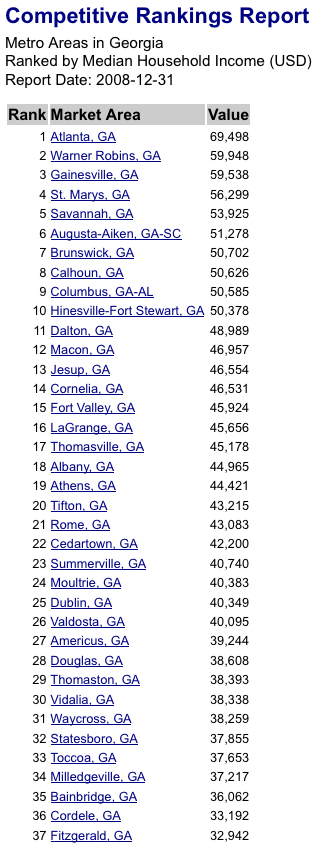
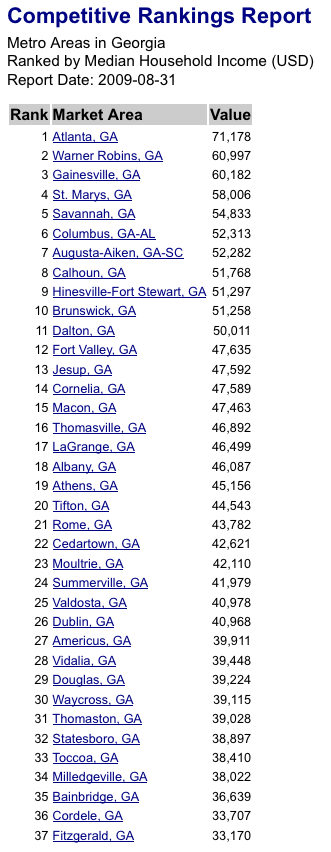
Sun Dec 13, 2009To compare with our previous post, the following tables show the Household Income for MSAs in the states of Mississippi and Georgia at the end of August 2008, December 2008, and August 2009, respectively. In Mississippi, over the past year, these tables show an average increase in the number of households per MSA of 0.79% and an average increase in the median household income of 3.21% per MSA. (Since the start of 2009, we see an average increase in the number of households per MSA of 1.19% and an increase in the median household income of 2.11% per MSA.) Changes in the median household income over the year has varied from a decrease of 1.5% in Brookhaven, and 1.4% in Grenada; to increases in Oxford (4.05%), Meridian (4.16%), Laurel (4.28%), Starkville (5.46%), Pascagoula (6.21%), Columbus (6.27%), Cleveland (6.73%), and Indianola (6.73%). Over the 12 month period, Mississippi saw growth in all of its MSAs in the number of households, varying from Clarksdale (0.26%), Greenwood (0.26%), Corinth (0.31%), Indianola (0.34%), and Greenville (0.37%), to Starkville (3.2%), and Biloxi-Gulfport (5.1%). Notice that the aggregation of these urban areas showed a cumulative increase in the number of households between August 2008 to August 2009 from 901,898 to 917,251 households (an increase of 1.70%), whereas the state of Mississippi showed an increase in households from 1.270M to 1.290M (a change of 19,280 households), and a decline in its average annual household income from $33411 to $32886, a drop of 1.57%. Georgia, on the other hand, has seen an average increase in the number of households by 1.09% per MSA, an average increase in the median household income of 3.25% per MSA. (This number is the average of the changes for each of the identified MSAs over the 12 month period from August 31, 2008 to August 31, 2009; the Atlanta MSA, which contains a significant portion of the population of Georgia, showed a growth rate of 3.671% in median household income. Since the start of 2009, we see an average increase in the median household income of 2.14% per MSA across Georgia, and an average 0.72% increase in the number of households.) Growth in the median household income over the 12 month period has been consistently positive with increases ranging from Fitzgerald (1.04%), Cedartown (1.51%), Macon (1.62%), Gainesville (1.63%), and Brunswick (1.66%), to Moultrie (6.56%), Thomasville (5.80%), Fort Valley (5.69%), and Columbus (5.22%). Georgia saw substantial growth over the period, with only Vidalia showing a very slight decline in the number of households (0.01% decline). Otherwise, the most significant increases in the number of households in Georgia were in Statesboro (2.16% increase), Warner Robins (1.96%), Valdosta (1.92%), and the Hinesville-Fort Stewart area (1.92%). Notice that the aggregation of these urban areas showed a cumulative increase in the number of households between August 2008 to August 2009 from 3.682M to 3.741M households (an increase of 1.60%), whereas the state of Georgia showed an increase in households from 4.036M to 4.098M (a change of 61,730 households), and a decline in its average annual household income from $48640 to $48330, a drop of 0.64%. Also, it should be noted that the consumer price index went from 218.783 at the end of August 2008, to 211.143 at year-end 2008, to 215.969 at the end of August 2009 (a 2.286% increase during 2009, but a 1.286% decrease over the 12 month period).
The following table lists the MSAs in Mississippi and Georgia, sorted by Median Household Income as of August 2008, year-end 2008, and August 2009.
 |
 |
 |
 |
 |
 |