
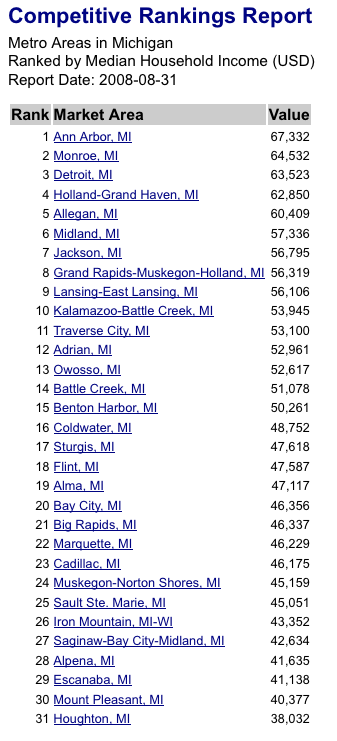
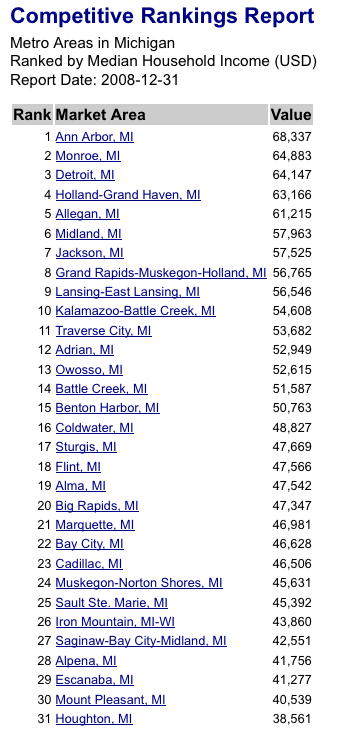
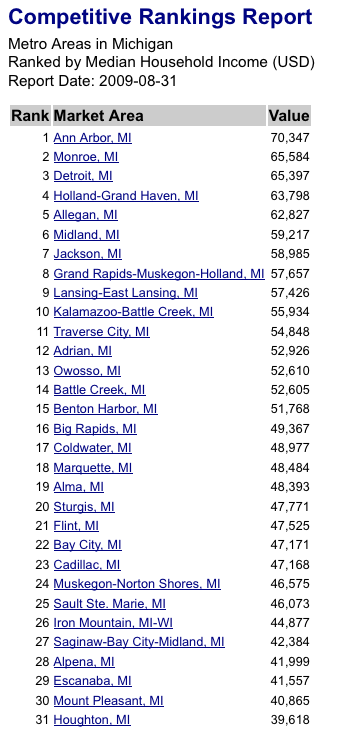
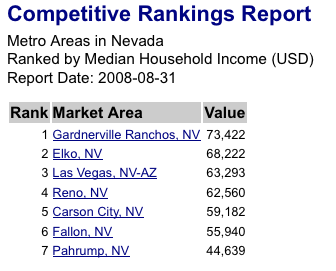
Michigan and Nevada MSAs by Median Household Income
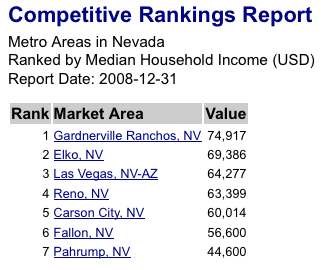
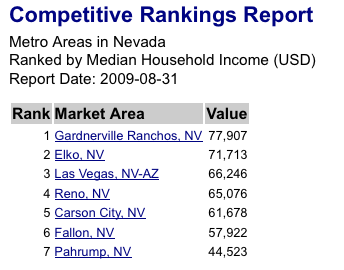
Wed Dec 16, 2009Completing our series (see here for our most recent post), we extend our visibility outside of the Southeastern U.S.; the following tables show the Median Household Income for MSAs in the states of Michigan and Nevada at the end of August 2008, December 2008, and August 2009, respectively. In Michigan, over the past year, these tables show an average increase in the number of households per MSA of 0.19% and an average increase in the median household income of 2.37% per MSA. (Since the start of 2009, we see the respective average increases in the number of households per MSA and median household income per MSA of 0.12% and 1.56%, respectively.) The Saginaw-Bay City-Midland, MI; Flint; Adrian; and Owosso MSAs experienced a drop in its median household income over the 12 month period from August 2008 to August 2009 (0.587%, 0.131%, 0.066%, and 0.014% declines, respectively). On the other hand, Big Rapids (6.54%), Marquette (4.88%), Ann Arbor (4.48%), Houghton (4.17%), and Allegan (4.00%) showed surprising growth in their respective median household income figures. Over that 12 month period, Michigan saw slight declines in the number of households in Alma (0.16% decline), Owosso (0.11% decline), Sturgis (0.06% decline), and Flint (0.05% decline), and the strongest growth was in Holland-Grand Haven (0.76% increase), Traverse City (0.59% increase), Monroe (0.47% increase), Allegan (0.42% increase), and Kalamazoo-Battle Creek (0.41% increase). Notice that the aggregation of these urban areas showed a cumulative increase in the number of households between August 2008 to August 2009 from 3.996M to 4.001M households (an increase of 0.14%), whereas the state of Michigan showed an increase in households from 4.536M to 4.543M (a change of 6,436 households), and an increase in its median annual household income from $46,451 to $46,901, an increase of 0.97%. Nevada, on the other hand, has seen an average increase in the number of households by 0.67% per MSA, an average increase in the median household income of 3.92% per MSA, over the 12 month window. (This number is the average of the changes for each of the identified MSAs over the 12 month period from August 31, 2008 to August 31, 2009. Since the start of 2009, we see an average increase in the median household income of 2.57% per MSA across Nevada, and an average 0.44% increase in the number of households.) Growth in the median household income over the 12 month period has been almost consistently positive, with the only decline seen in Pahrump (-0.26%); increases peak in Gardnerville Ranchos (6.11%), Elko (5.12%), and Las Vegas (4.67%). Nevada generally witnessed growth over the period, with only Pahrump and Carson City showing very slight declines in the number of households (0.57% and 0.02% declines, respectively). Otherwise, the most significant increases in the number of households in Nevada were in Las Vegas (2.76% increase), and Reno (0.94%). Notice that the aggregation of these urban areas showed a cumulative increase in the number of households between August 2008 to August 2009 from 1.090M to 1.114M households (an increase of 2.24%), whereas the state of Nevada showed an increase in households from 1.131M to 1.155M (a change of 24,684 households), and an increase in its average annual household income from $55,396 to $57,221, a rise of 3.29%. Also, it should be noted that the consumer price index went from 218.783 at the end of August 2008, to 211.143 at year-end 2008, to 215.969 at the end of August 2009 (a 2.286% increase during 2009, but a 1.286% decrease over the 12 month period).
The following table lists the MSAs in Tennessee and North Carolina, sorted by Median Household Income as of August 2008, year-end 2008, and August 2009.
 |
 |
 |
 |
 |
 |