
 Subscribe to our blog feed
|
 Receive blog updates by email via Feedburner
|
Mapping Images with Capitalytics
Posted on Wed May 15, 2013We are pleased to announce that we have deployed several new features to plot locations of banks, branch offices, assets, and bank clients. We are now using Stamen Design's maps within our service, in conjunction with the R Project for Statistical Computing.
With this new capability, we can now produce a broad variety of images to help our users (and their examiners) easily visualize competition, investments, and market penetration. For instance, the following image shows the deployment of deposits across branch offices in the zip code 35209.
Contact us to see what we can do to help you visualize key aspects of your bank's operations.
Capitalytics Universal Dashboard
Posted on Thu Mar 28, 2013As some of our users have noticed, Capitalytics' dashboard has undergone some changes -- both on the inside and the outside. On the inside, the dashboard has been redesigned from the ground up to improve its performance as well as its ability to be customized on a per-bank and per-user basis. These improvements allow for banks to be able to assemble a unique set of panels to direct their production officers on which instruments are objectives of growth for based on the bank's strategy, while still allowing the C-level officers of the bank to maintain their high-level view of issues within the bank. This improvement in functionality and scalability is what gave rise to re-branding this central access point as the "Capitalytics Universal Dashboard".
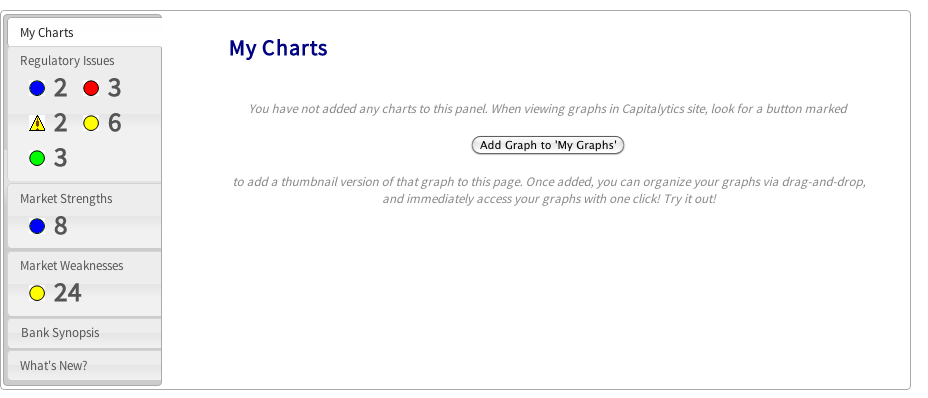
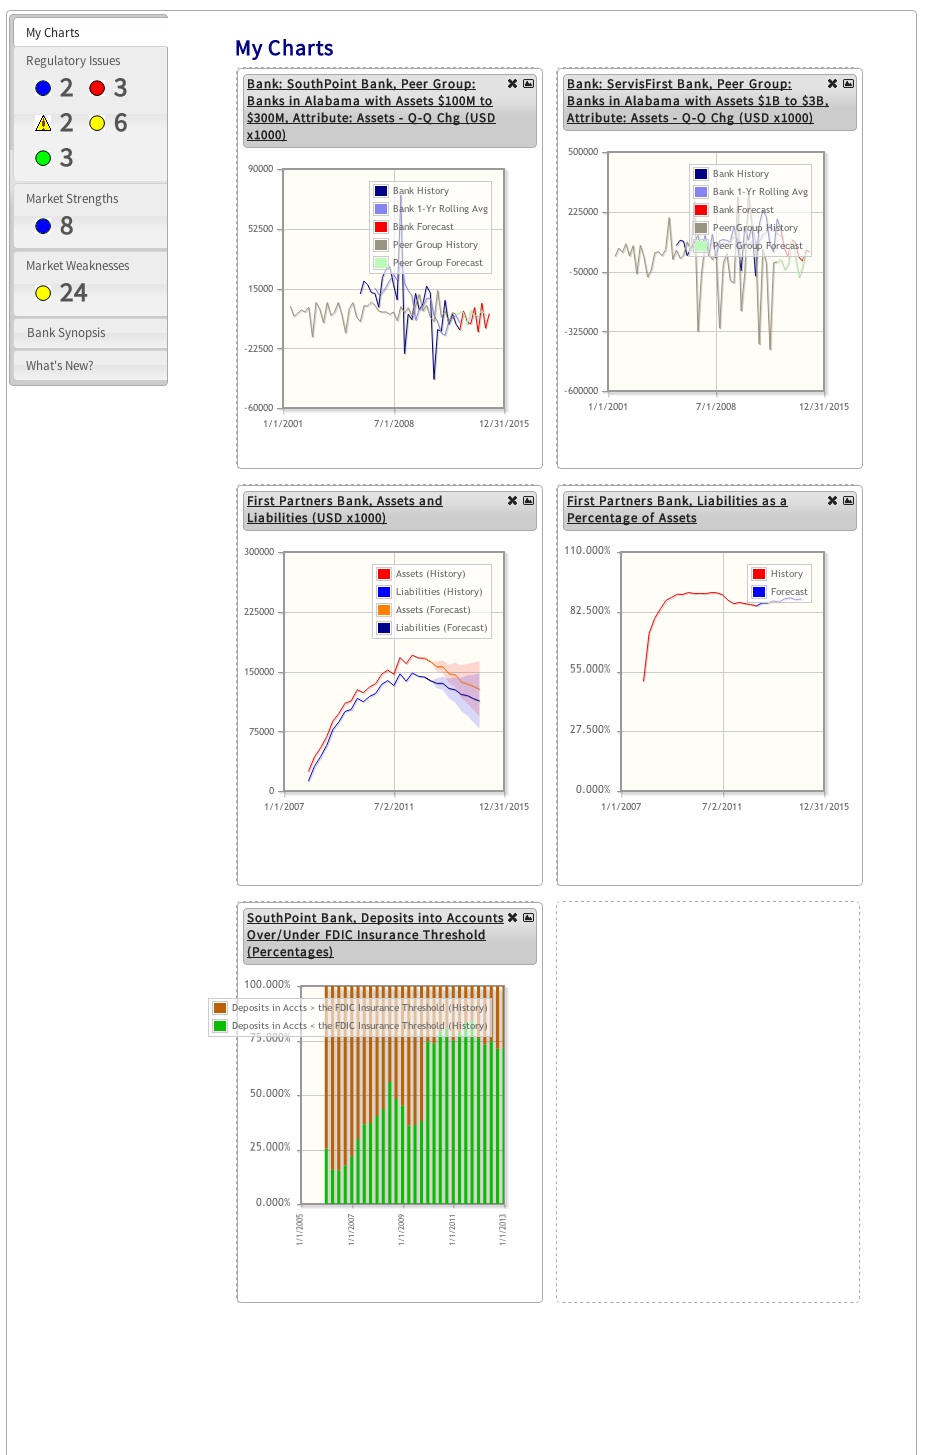
Inside the dashboard, we have also released a newly available panel called "My Graphs". This panel is immediately available when you log in to our system, and provides thumbnails of charts of interest that can be selected from anywhere else within the system. From this panel, you can re-arrange reports by dragging the title bars about the page, and view the pages from which the reports were selected by clicking on the title of a chart.
Contact us today to talk about how we can help you maintain the flow of information within your bank!
Capitalytics in Action: How to Identify Peer Banks with Capitalytics
Posted on Mon Mar 25, 2013One of the points that we have made several times is that the details of the business model for a given bank has a dramatic impact on what other banks should be considered to be peers, and what other banks should be used for comparison purposes. While it is very easy to simply look at the 10 or 15 closest banks that are comparable in size to your own and declare them as "peers", banks which emphasize commercially oriented lines of business, as opposed to consumer oriented products, will succeed based on different market conditions.
Capitalytics offers a report (under "My Bank" -> "Ranked Comparable Peer Banks") that digs deeper in a selected set of banks in order to identify which banks are truly the most similar to yours. Providing this type of guidance gives a board of directors a better sense of with whom a bank's success should be tracking, and should instill more confidence in the management team.
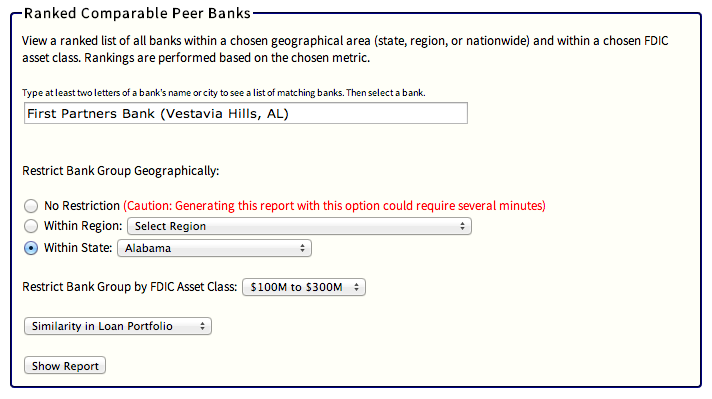
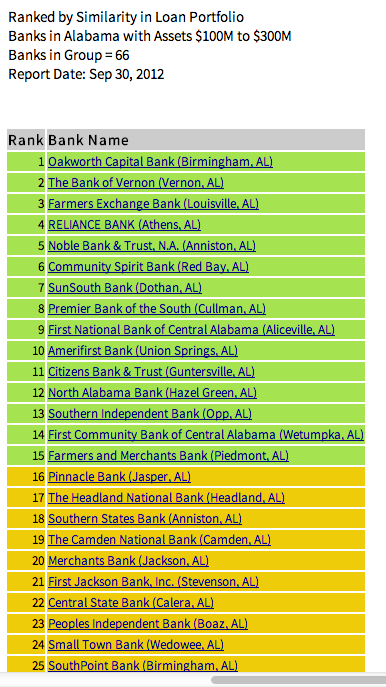
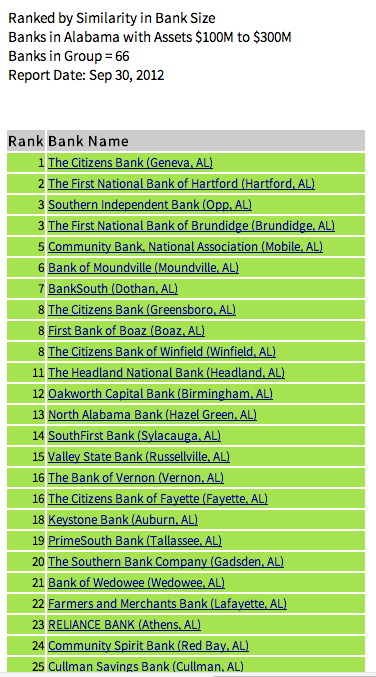
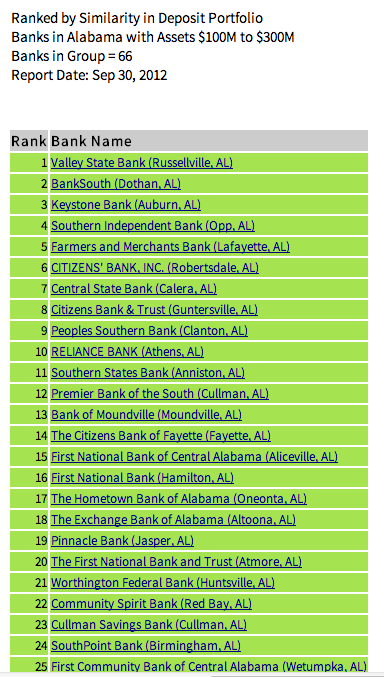
For example, we benchmarked the 25 banks with assets in the $100M-$300M range that were the most similar to First Partners Bank in Vestavia, AL as of Sept 30, 2012. We benchmarked these banks across four different criteria in order to emphasize that a bank is only a comparable bank within a specific context.
 |
 |
 |
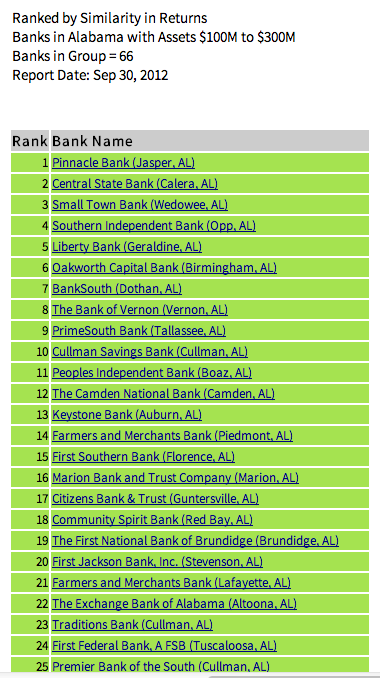 |
In these results, we see that banks, like Oakworth Capital Bank in Birmingham, AL, are very similar when considering the banks' respective loan portfolios, less similar when considering bank size and returns, and not nearly as similar when considering the banks' deposit portfolios. (The colored bars in our tables indicate whether a bank meets a given threshold in terms of similarity. In the first three cases mentioned, Oakworth is still very similar to First Partners Bank, but it is obvious that the similarity varies with the conditions applied.)
If you have questions about which banks are appropriate peers for your market comparisons, contact us today, and we would be glad to help your bank.
Capitalytics in Action: Case Study #3
Posted on Wed Jan 23, 2013This article concludes our series of "Capitalytics in Action" blog posts, in which we illustrate via a series of screen shots how bankers can use Capitalytics to more effectively deal with a wide range of challenges and opportunities facing their banks.
Case Study #1 illustrated how Capitalytics leverages FDIC call report data and other publicly available information (e.g., population, labor force, unemployment rate, etc.) to generate high-level reports and analyses about a bank's current market position. Case Study #2 demonstrated how our Cashflow Modeling Engine leverages record-level data about each of a bank's accounts to perform interest rate risk analysis, liquidity risk analysis, and stress testing.
Case Study #3 showcases a collection of Capitalytics reports that are probably best described as "Operational Analysis" tools. These tools combine publicly available data with a bank's proprietary data to identify a wide variety of opportunities for improvement in a bank's performance. In this case study we illustrate our custom Executive Summary report, Key Performance report, rankings reports, Bank Overview report, Balance Sheet and Income Statement reports, and various other reports that highlight specific opportunities for improvement. All of these reports are designed to support "drill-down" into specific geographic or hierarchical segments of a bank, thereby allowing a banker to perform arbitrarily fine-grained analysis on a variety of metrics and reports across the bank's corporate structure.
All reports in this case study are provided for a fictional "Sample Bank". In general, use of these reports requires that a bank provide Capitalytics with access to certain proprietary data. All reports are highly customizable based on your bank's needs. For more information about Capitalytics's custom reporting capabilities, please see this article or contact us.You can download Case Study #3 here.
Capitalytics in Action: Case Study #2
Posted on Mon Jan 07, 2013This article continues our "Capitalytics in Action" series, which illustrates how Capitalytics tools can help bankers to more effectively navigate the landscape of challenges and opportunities that they face.
The first case study in this series illustrated how Capitalytics mines FDIC quarterly call report data to produce various reports and analyses about a bank's strengths and weaknesses, market opportunities, competitive threats, and regulatory issues.
Case Study #2 demonstrates various reporting and analysis features related to our Cashflow Modeling Engine. The Cashflow Engine performs "record-level" simulations of a bank's entire portfolio of accounts — both assets and liabilities — and enables a wide range of analyses under various assumptions.
We described our Cashflow Modeling Engine in greater detail in a series of recent articles, including an overview of cashflow analysis as well as related articles on deposit modeling, interest rate risk analysis, stress testing, and liquidity risk modeling. This case study provides sample screen shots of the Cashflow Engine and its various reports in action for a fictional "Sample Bank".
Case Study #2 is available for download here.
Capitalytics in Action: Case Study #1
Posted on Tue Dec 18, 2012This is the first in a series of articles that illustrate how Capitalytics reports and analysis tools can be used by a bank to identify and better understand the specific challenges and opportunities that the bank faces. The case studies are presented in the form of slide decks from a recent presentation that we did.
The first case study is for a bank in Birmingham, Alabama. We have withheld the bank's name; however, all reports and tools that we show in this case study are based on publicly available data from quarterly FDIC call reports.
You can download Case Study #1 here.
Is My Bank Really Big Enough to Justify Thorough Analysis? The Short Answer Is Yes.
Posted on Mon Dec 03, 2012While meeting with the CFO of a $200M bank, he described that he currently had his spreadsheets set up to import data from his core system, make a few back-of-the-napkin judgments, and come up with a reasonable estimate for his interest rate and liquidity risk. He argued that he had been through exams within the past few months with both federal and state examiners, neither of which raised an issue. As a result, he asked us if there was enough of a benefit from a solution like Capitalytics to justify an investment.
The short answer is yes -- even if your bank already has a process in place, the integrated value proposition of a sophisticated service like Capitalytics is compelling enough to warrant a second glance. Here's why.
- Integrated Offering - Many community banks assume that, by virtue of their size, they cannot afford integrated analysis suites, and users are comfortable acting as intermediate conduits between spreadsheets (where calculations may be "tuned") and applications. Thinking about the time, and the value of that time -- as well as how small banks are current being pressured by regulators and the market to "do more with less" -- should give one enough pause to realize that every minute in a community bank is vital to the bank's success. Integrated packages are not luxuries, but should be strictly scrutinized for the value that they bring to the table. Capitalytics, for instance, easily takes information from your bank's core system and uses it in several facets of its analyses so that actionable results are only one click away.
- Lower Cost - In these times of hardware commoditization, the cost of a powerful server that has a life of two to five years can be measured in less than a day of the time of a busy bank executive's time. This means that, if, in the span of a year, a computer can save a single day of an employee's time (provided the money and work are both available), then the investment is valuable and should be seriously considered. Capitalytics takes the same approach: by carefully working to manage our own operating costs, we are able to offer a recurring service that takes the place of several sophisticated employees and/or contractors who understand the availability of quantitative resources, web based software development, information security, databases, and algorithms for a price of a few hours of the bank executive's time. Since our price is tiered based on a bank's assets, it is only in the case of a $10B that our price approaches the unloaded salary of an employee. With that, our service offers analysis of your bank, its portfolio (including risk metrics for examiners), its peers, its markets, its employees' productivity, and documentation for quarterly reports and exams (including geocoding for CRA and HMDA) -- all available any time that you need answers.
- Start with Simple, and Grow to Complex as Necessary - While we do have several tools and resources available to our customers, one of the key aspects of our service is the fact that we know that your bank doesn't necessarily need the "kitchen sink". We are glad to tailor our offerings to provide the service that you and your bank need. If your bank doesn't need interest rate risk reports, they are gone! Don't need productivity measures at the employee level? We won't produce them. Similarly, if your Board wants reports to be produced "just so", let us see what you need, and we will be glad to generate them for you.
There is no question that juggling reports and analyses for bank management, Board members, and regulators is a difficult job. Contact Capitalytics today to see how we can help you manage the requests and be more productive.
Information Needed for Cash Flow Models
Posted on Wed Nov 07, 2012We recently visited a banker with whom we have had several conversations, and the discussion finally turned to a concrete back-and-forth over what was necessary to implement a trial with them. This is a conversation that we have had several other times, but we decided that we would provide a list of the instruments supported and data requirements that could be forwarded to his bank's IT staff.
Moreover, since this is a point that does get raised periodically, providing this information to all of our users and prospective users seems like a wise option.
- Fixed-Rate & Floating-Rate Bonds, and Mortgage Backed Securities - At a minimum, we need to know the type of instrument, the face value, origination date, duration (or maturity), and the rate information for the bond(s), including any unusual coupons, the index against which the bond is issued, and/or the offset from a given index. If there are any unusual items associated with the instrument -- such as the calendar against which the bond is issued, the redemption amount, the settlement period, purchase discount, or payment convention -- we need to know that information as well. We can use an identifier and bookkeeping tags of your bank's choice, particularly if we discuss any unique ways that your bank aggregates holdings or profits (e.g., municipal bonds, agency instruments, etc.). Finally, if your bank applies transfer pricing to bonds, we can also accommodate accounting for the internal spread (versus the overall spread).
- Vanilla Swaps - Capitalytics supports simple swaps, and we would be glad to understand if your bank requires modeling other, more exotic, instruments. For swaps, we simply need to know the instruments on both the "pay side" and the "receive side", particularly their rate terms.
- Fixed-Rate & Floating-Rate Closed End Loans - For these instruments, we need to know the type of instrument, the product (in terms of what your bank is providing, e.g., a first mortgage, or other type of collateralized or secured loan), the total loan amount, the origination date, the expected maturity date, and the rate information for the loan, including "teaser rates", the index on which a variable-rate loan may be issued, and/or the offset from a given index. We will also need to know the payment schedule (payment due dates), and if there are any unusual provisions that should be accounted for if the borrower's payment is late. We support funds transfer pricing, so we can track the spread and profitability assigned to a field office or business unit at your bank. Again, we can use an identifier and bookkeeping tags of your bank's choice, particularly if we discuss any unique ways that your bank aggregates holdings or profits (e.g., zip code, risk rating, collateral rating, call report categorization, borrower's NAICS or SIC code, etc.).
- Fixed-Rate & Floating-Rate Open End Loans - For these accounts, we again need to understand what type of product you are providing, such as a HELOC or a revolving line of credit. The information that we would require is very similar to the "Closed End" loans mentioned above, but, instead of our being able to determine the minimum required payment based on the maturation of the note, we would need to know your borrower's credit limit for each account and your bank's minimum requirement payment terms, so that we can correctly and accurately model the instrument.
- Balloon Loans, Hybrid ARMs, and other Non-Standard Loans - In spite of their unusual nature, these instruments' requirements (in addition to the points mentioned above) are fairly straightforward. For balloon loans, we need to know the amortization schedule for life of the loan, and when the balloon payment will become due. For Hybrid ARMs, we need to understand the fixed- and floating-rate schedules, and the terms associated with each. And we can accommodate other types of "non-standard" loans; just contact us to discuss your portfolio.
- CDs and Demand Deposit Accounts (incl. MMAs, Checking & Savings Accounts, etc.) - Deposit accounts are also straightforward in their requirements. For CDs, we need to know the date on which the account was opened, the maturity date, and the rate information for the account. For demand deposit accounts, we simply need to know the interest accrual terms at a minimum. If you would prefer, we can use our demand deposit analyzer (discussed here) to determine the trends associated with your account holders' saving/spending patterns, and provide the best understanding of the liquidity that you bank may be able to expect in the future. We also need to know any terms and fees for your products available (e.g., overdraft fees), and other key factors provided.
Leveraging Data in Banks for Market Share and Profitability
Posted on Tue Oct 16, 2012New businesses are typically classified as one of three types by investors: a vitamin, an aspirin, or a condiment. "Vitamins" are businesses that generate new revenue to their clients; "aspirins" reduce expenses for their clients; and "condiments" are tasty, but don't provide much quantifiable value.
While it is easy to see that Capitalytics could be viewed as an "aspirin", checking the boxes and generating documents that regulators want to see from banks as a matter of process, we also offer our banking clients a "vitamin": the opportunity to find their "sweet spot", accentuate their strengths, and increase their bottom line profits.
Capitalytics can classify all of a bank's instruments into multiple groups, down to and including classification by the loan officer who "owns" or otherwise may be responsible for an account. So we can easily show a bank the areas, lines of business, and individuals who are most successful at generating profits for the bank. With this information, wise management can determine how to structure incentives so loan officers will continue to produce desirable results. In addition, Capitalytics can identify and track the progress of less productive areas or personnel. This information can help our clients repurpose or reduce the aspects of their business that are less profitable or unprofitable. As a result, we can help banks enhance their ROI by increasing returns and decreasing investment.
We are very flexible and focused in our desire to help our clients and generate value. We strive to understand our clients' needs and are willing to create new reports for them -- at little or no up-front cost -- to help them run their businesses as efficiently as possible by identifying the most profitable or unprofitable areas of their business. For banks that are proactive about improving their profitability and market share, the breadth of areas in which we can help is virtually unlimited. Contact us today to talk about how Capitalytics can help your bank enhance its competitiveness and its bottom line.
Liquidity Risk Modeling
Posted on Thu Sep 20, 2012Liquidity risk is another "hot button" topic of examiners these days. In particular, there is strong interest in how banks of all sizes perceive their liquidity changing when interest rates rise. This question is not so much about any immediate expectations, but, as in the case of Interest Rate Risk analyses, examiners seem to want to make sure that bankers are aware of possible events that could easily occur, and have gone through the "what if" thought exercises so they are more prepared to react when significant events do occur.
Our model for simply getting an initial understanding of a bank's liquidity risk is a simple and well known one: since understanding liquidity risk revolves around the case of "something bad" occurring that motivates a bank to conserve capital and ride out a (proverbial) storm, we analyze the case for a bank's portfolio in which no new investments are made over a relatively long period of time. As new instruments mature, they are not renewed. This policy builds a war chest of immediately available capital which, in conjunction with a bank's lines of credit, is the theoretical best situation that a bank can be in when preserving its solvency.
This provides a "snapshot" of what might happen to a bank under undesirable circumstances. But while a picture may be worth a thousand words, it is only part of the story. The problem comes in understanding how the results that are captured in this picture can be leveraged in a real-world situation when absolute policies cannot always be adhered to. To survive an actual crisis, understanding the sensitivity of (in this case) the bank's liquidity to each of the key factors involved will provide extremely useful guidance in how to make day-to-day decisions in the real world.
Based on this understanding, Capitalytics provides several other similar scenarios that you can use to help your bank capture its sensitivity to different factors when stressed. For instance, not only do we provide a "one click" option to model new investments at 0% of their forecast levels, we also allow you to see how your bank's liquidity changes as new investments are stepped down from 100% to 90%, 75%, 50%, and 25% (and ultimately 0%) of forecast values.
This, however, is still not the entire story. From the point of view of a liquidity risk model, there are two factors that can affect a bank's liquidity: the bank's outflow of funds to investments, and its (difficult-to-control) outflow of deposit funds. To allow you to understand your bank's sensitivity to these withdrawals, Capitalytics has implemented additional scenarios to model increased withdrawal rates (where our deposit & withdrawal policies are discussed here). We have preconfigured simulations that increase withdrawals by 25%, 50%, 75%, 100%, 200%, and 300%. Furthermore, in a time of crisis, uninsured deposits will likely be withdrawn faster than insured deposits; as a result, we have provided the parameters for scaling both total withdrawals and uninsured withdrawals separately.
While we have gone to great lengths to provide a robust set of tools to help you understand your bank's liquidity, we realize that every case is different and we are glad to help with your bank's specific needs. Contact us today to discuss how Capitalytics can help your bank.
Stress Testing
Posted on Tue Sep 11, 2012We have encountered quite a bit of ambiguity and confusion around the term "stress testing" as we have spoken with bankers. Only recently has it become more clear which banks are required to implement stress testing exercises or regimens to the community as a whole. As one might guess based on our previous posts, we believe that every bank could benefit to some extent from the analytical exercise in stress tests, and our goal is to help banks make the process less tedious and as productive and efficient as possible.
Based on our discussions with regulators, the purpose of their "stress testing" requirement is to motivate a bank to determine where its correlated risks lie, and to document what measures it has taken to minimize the potential for the bank to be impacted (to the potential point of insolvency) by a single, non-obvious external event over which the bank may not have any control. For instance, that event might be an asteroid from space crashing into the city of Reno, NV or the unexpected closing of a correspondent bank. In either case, regulators want a bank to understand how the ripples from these events will affect the bank's overall position.
Our framework for thinking about these situations is based not on rooting our the correlations, but characterizing the effects. Specifically, we characterize a stress test as being the impact of the bank's default rate for specific sets of its financial instruments (presumably its assets). Here's how it works. First, when we import a bank's portfolio into our database, we expect the bank to provide us with information about how it groups its financial instruments (e.g., "Municipal Accounts", "Home Equity Lines of Credit", "Treasury Bonds", etc.). Then, to create a stress test, we ask that a bank define and name a specific scenario (e.g., "Medium Crisis", "Failure of All C&I Loans in Oklahoma", etc.).
After defining and naming a stress test scenario, the bank can identify three items:
- Which group(s) of assets are affected in this scenario?
- For each affected group, which asset-holders would be impacted to the point of failure first, and which would be affected later? In other words, what attribute of the asset holder would determine when the asset would be defaulted on (e.g., loan size, outstanding loan balance, credit score, etc.)?
- For each affected group of asset holders, when would their defaults first be felt by the bank relative to the beginning of a simulation, and over what period during a simulation would their defaults be seen? For example, a bank might anticipate that its asset holders have a cash reserve (in proportion to the attribute mentioned in the previous question) that would be depleted over the first two to ten months of the simulation.
Capitalytics makes stress testing easier by allowing a bank to specify the scenarios that are of interest -- assumably the most realistic potential risk scenarios, and those that may be discussed by the bank's Board of Directors on a regular basis -- and then having these scenarios run regularly and automatically. The output that we produce is intended to fuel periodic discussions about how to manage and mitigate risk so that the bank is more prepared to react when issues do arise.
Contact Capitalytics today to tell us about your bank, and how we might be able to help.
Interest Rate Risk
Posted on Fri Sep 07, 2012Interest Rate Risk has become the subject of significant scrutiny within the banking community over the past few years as the economic climate has changed. Capitalytics is extremely sensitive to the needs of banks to not only perform interest rate risk analysis as part of their regulatory examinations, but also use it as a tool to help banks prepare for additional changes in the environment and maximize their profitability based on expected trends in market rates.
We have elaborated in several of our recent blog posts about the capabilities of our Cashflow Simulation Engine, particularly its robustness and ability to provide results at a level of granularity and accuracy above and beyond what is available from simple analytic techniques. This has two main benefits when analyzing your bank's interest rate risk.
- Our simulation-based approach allows for arbitrarily detailed analysis of how specific financial instruments will react to interest rate fluctuations in light of floors, caps, and other subtle nuances that may be offered as part of these instruments. We can also easily and correctly deploy new "flavors" of instruments in which your bank may participate, regardless of their nature.
- Our approach also removes the limitations of publicly available yield curves (e.g., LIBOR, swap curves, etc.) Many correspondent banks and other services do not allow for banks to grow in their sophistication by not integrating their third-party reports with the curves that may be most beneficial. But Capitalytics, on the other hand, is able to receive and make use of periodic updates to the yield curves that your bank would like to use as part of their business -- or to temporarily or permanently use functions of publicly available curves (e.g., "WSJ published Prime Rate + 25 bp") in order to provide the knowledge that today's bankers need to survive and thrive.
We maintain a sample bank as part of an openly available demonstration of our capabilities, including interest rate risk analysis and reporting, here. Click the tab labeled "Cashflow Reports" to see the selection panel for our reports. Contact us today to discuss how we can help your bank.
Deposit Modeling
Posted on Wed Aug 29, 2012In our last post, we discussed the issues around why a bank might want to use a simulation system rather than closed-form equations or simple algorithms to drive their internal thought exercises, and satisfy examiners. To recap, while a formula-driven approach may provide a "first order" estimate of risk or other factors, simulation is the only way to capture real-world phenomena such as prepayment estimates (whether they are cyclic, provided by a third-party, or otherwise generated), instrument interdependencies (e.g., overdraft protection, which can be a significant source of fee-based revenue), and defaults.
Part and parcel of a simulation based approach, however, is the need to have a firm handle on depositor liquidity based on both a quantitative analysis of each depositor's past behavior, and an understanding of their business model within the context of the bank's overall deposits. In other words, insofar as a single depositor or a group of "connected" (correlated) depositors can "move the needle" of the bank's funds, the bank will need to understand how that depositor or group of depositors behaves.
Since our Cashflow Modeling Engine actually runs a day-by-day simulation of each account or record at the bank -- both assets and liabilities -- we can uniquely tell a bank what the expected behavior of a single depositor may be under different circumstances. Before running a simulation, we collect all of the past history for an account and build several different models for that account's balance based on (a) short term (6 months) or (b) long term (3 years) histories. In both cases, we then build a "straight (trend) line" and a more exotic distribution to fit that account's balance history in order to drive our simulations.
As a result, we can work with a client to either look at their depositor balances on a simple, intuitive basis, or a more quantitative basis. What is the benefit of this "either/or" approach? While the intuitive approach may yield an "extremely likely" result with less computation, the distributions that we build for each account allows us to operate a fully-functional and correctly implemented stochastic simulation that can be run several times until confidence intervals for the bank's future performance can be identified. Without performing this type of statistically valid analysis on each account, a bank cannot fully appreciate how quickly its position may be impacted in times that the financial system may be stressed. Capitalytics is proud to be the first service provider to make this level of power and analysis available to the community banker in a cost-effective manner.
If you and your bank would like to benefit from this type of service, contact Capitalytics today. We would be glad to work with you to understand the risks and the strengths of your institution.
Cashflow Analysis
Posted on Sun Aug 26, 2012Many products, services, and consultants claim to provide immediate or near immediate analysis for banks to identify their liquidity and other areas of risk. Most of these offerings are based on extremely simple algorithms that oversimplify the constraints of real-world products, and break-down when exposed to the the actual terms and conditions of different products (e.g, overdraft draft protection for retail accounts, and floors and ceilings on rates).
At Capitalytics, to ensure the most robust analysis possible, we have gone to great lengths to implement an actual simulation system that steps through all of a bank's instruments for each day, and actually models what will occur under real-world circumstances. We have been building simulation systems for over 20 years, and have leveraged all of our expertise to build a system that is:
- Scalable -- meaning that it performs as well with a million instruments as it does for a few dozen;
- Extensible -- meaning that it can easily accommodate new instruments, including those that impact each other through interdependency relationships, such as overdraft policies require; and
- Intelligent -- meaning that, not only can our customers always run new models on-demand, but we have also gone to great efforts to precompute expected models for our customers automatically, AND we have designed our system to take advantage of those portions of previously computed models that can be effectively reused to provide results to customers more quickly.
We have found that many consultants and services simply look at call report data, run a few "back of the napkin" calculations, and come up with how your bank (or a competitor) will perform under a stress scenario. While there is certainly value in first-order estimates, any competent analyst knows that publicly available call report data rarely tells the entire story about a bank. Most banks will use their then-current strategic objective to determine how exactly specific instruments are reported, and then justify their position to examiners if necessary. Scenarios that entail risk are, by definition, "corner cases" that require more scrutiny than uniform and homogeneous solutions (like a "back of the napkin" calculation) can provide. While these simple computations may give an overall sense to management of where they might end up in a crisis, understanding the sensitivity to fluctuations in the exact situation is what a set of simulations can provide that simple calculations do not. In other words, these simple calculations cannot answer the question of how much worse your bank will fare if interest rates are 10 basis points higher or lower than your first-pass guess?
Over our next few blog posts, we will describe how we use our Cashflow Modeling Engine to provide liquidity risk, interest rate risk, and stress tests (among other things), as well as other key aspects of our product. But the main takeaway from this post is that our product has been vetted to provide: (a) the analyses that regulators are requiring banks to perform, and (b) timely information that banks can use to increase profits.
Capitalytics Custom Reports
Posted on Wed Mar 21, 2012Being a small and efficient business, we at Capitalytics are very proud of our ability to rapidly deploy custom reports that are tailored to your bank's needs and culture.
Currently, our report span a gamut of bankers' needs:
- Executive Reports:
- Executive Summary Report - a "plain English" bullet list of the issues, good and bad, that warrant attention
- Key Performance Report (4 versions) - a one-page overview of your bank's operation
- *NEW* Bank Revenue per Client Report (Client Value) - a ranked list of the most important clients of your bank
- Operational Reports
- Ranked Areas by Operating Attribute - a list of the areas within your bank, ranked by any of dozens of attributes
- Operating Attribute Graphs - a view into any of several hundred operating metrics for your bank and its peers
- *NEW* Waived Fee Report - a list of the areas and officers within your bank, sorted by granted waivers to identify problem clients and cultural issues
- Portfolio Reports:
- Loan Portfolio Report - a list of the amount contributed by an officer or area of a bank to the bank's overall portfolio, presented in a drill-down format
- Loan Detail Report - a detailed, sortable listing of all loans that are managed by an area within your bank, including the profit projected per loan
- CD Detail Report - a detailed, sortable listing of all CDs that are sold within an area of your bank, including the anticipated profit per instrument
- Low Spread CD Report - a list of the CDs sold at a sub-par rate, organized as in a drill-down format
- Cashflow Simulation Output Report - an active, programmable simulation engine that imports your bank's portfolio, and forecasts cashflow based on your expected yield curve, renewal rates, and other inputs
- *NEW* Liquidity Risk Report - a listing of the cash surplus or shortfall per grouping of instruments under different cashflow simulation assumptions
Any of these reports (or other, new reports that you spec' and we generally develop for no cost) can be deployed for your bank, and customized based on your needs. Please contact us if there is anything that we can do to help your bank.
Data, Data Everywhere ... But Not a Drop to Drink
Posted on Tue Feb 14, 2012In case you have been under a rock for the past few years, you have probably heard that data is one of the mantras of the Internet these days. Processing the metric tons of data that apps' and websites' logs produce has become the magical use of all of the inexpensive storage and processing power that is now being churned out.
While it is amazing what knowledge can be gleaned from these mounds of data (notice the deliberate difference in those two nouns), there is a key corollary that is typically expressed as a cliche': "Garbage In, Garbage Out". In fact, it might be more appropriate to mangle that expression as something akin to "Garbage In, Misdirection Out", meaning that, while "Garbage" is without value, the analysis of that same data can lead your bank in a dangerous direction of spending money & time on losing propositions and mis-informed conclusions.
In deploying our system, we have had bankers say "Our officers don't always collect/provide/enter that data; that's okay, isn't it?" The short answer is that it isn't okay. The first step in this case is identifying and screening the erroneous data -- not a trivial task since incorrect data is rarely as easy to spot as "O"s and "l"s in place of zeroes and ones. Still, we have developed something of a knack for scrubbing data. Once scrubbed, the resultant pool of data may be diminished, but it is at least accurate.
Cultural issues are usually the most difficult ones to address in an organization, and personnel sensitivities can be require a deft touch to work through. However, to get the answers that an organization needs, decisions must be made based on the reality of the context, i.e., accurate data. We cannot tell a banker how to motivate personnel to provide the necessary information, but, without that correct data, it is extremely difficult to not steer an organization towards an undesirable endpoint, and virtually impossible to reliably and consistently steer an organization towards a stated objective.
Rules for Bankers to Follow When Using Data
Posted on Wed Feb 08, 2012One of the key hingepins of Capitalytics' offering is that your bank's data -- data about clients, employees, markets, and products -- can be used to provide a more profitable banking operation. By understanding the factors that drive revenue, both positive and negative, we feel strongly that community bankers can end up in a better place than they might otherwise find themselves.
As a result, we've found several common issues that typically plague bankers when they try to start a project that involves collecting data and analyzing that data in order to understand the proverbial "where they are" and "where they are going".
- Define your hypothesis.
- Plan to fail ... and adapt.
- Start small.
- Know what you can invest in the project up front...
- ...and what that maximal investment might return.
- Data quality is Job 1.
- Make sure that you aren't trying to swim against the tide.
Do you have any idea of what you're trying to prove? Perhaps it is suspected trend in a specific market that you can position yourself to exploit. What's your basis for believing it? If you are correct, will implementing a solution or a strategy "move the needle"?
Hunches don't always work out. If you have identified a problem, but realize that you don't know what the solution is, how will you track down the root cause? Do you have the data you need in order to identify the root cause? If not, where can you find it?
Now that you have a hunch about how to exploit or fix the problem, how do you cost-effectively begin to test it? Rather than investing thousands of man hours, can you scope the project to prove or disprove your theory and test your solution to it on a small scale ... geographically or otherwise?
How much "capital" (time, or relationship) do you have to invest in a project that will likely morph?
Make sure you manage the expectations of those involved, by knowing roughly what to expect in the best-case scenario.
As we've said before, when it comes to your data and the decisions you make with it, "garbage in equals garbage out". What will you do when you encounter the inevitable imperfections or inconsistencies in your data? How will you ensure that your conclusions and decisions are based on accurate, reliable data and not the result of anomalies or inconsistencies in the format or semantic meaning of the input data?
You will likely find that most of your organization's problems are rooted in its cultural issues. Are you sure that your conclusions and recommendations will be embraced by your organization? And if not, are you willing to expend the effort necessary to change people's minds?
Contact us now to see how Capitalytics can help you design and implement a program to maximize your organizaion's operational returns!
Usability
Posted on Wed Feb 01, 2012One of the things that we at Capitalytics noticed early on, and had noted in our conversations with bankers, was the difficulty in using websites that currently post public data. It is not terribly surprising giving the obligation that these services have for producing public data, and the resources with which they have to work, that user experience and the ability to easily integrate information for their users is not the first priority for these services.
On the other hand, from working with other web-based services, we have learned that User Interface design is one of the most important aspects that we have tried to integrate into using our service. User Interface ranges from not only the design of every web page, to understanding each activity that a user performs, to understanding the high level questions that a user needs answered.
In order to take advantage of the maximum amount of reusable tools, Capitalytics leverages the latest versions of the jQuery library. jQuery offers a well tested set of cross-browser tools that ensures a very robust experience for all of our users. In cases that certain functions are not offered by jQuery, though, we don't sacrifice the needs of our users; we simply end up adapting our testing to provide the assurances that our Javascript based functions are completely reliable.
Additionally, our back-end functionality has been carefully developed to ensure rapid response time to user queries. Our databases (and their indexes) have been developed to perform well under load, specifically targeting that all of our reports be able to be generated in under ten seconds under heavily loaded conditions. Our databases may not be fully normalized, and certain values may be pre-computed in order to improve the speed with which reports are rendered, but sacrificing the academic cleanliness of a databases in order to ensure our site's performance is a compromise that we have found is well worth the investment.
Finally, we run automated processes to check the security and speed of answering user's requests. And, while we do rely on these logs and our own judgment, we ultimately count on feedback from our users in order to make sure that we are providing a valuable and usable service. We place a form on every one of our webpages (that collapsible form at the bottom of every page marked "Submit Feedback about This Page to Capitalytics") that invites feedback from our users. And we take every piece of feedback very seriously -- try us! We'd love to hear from you. After all, like any other service, we are looking to provide value to every one of our users, and, without that value, we would all be doing something else! So please contact us if there's anything that we can do to make our service better!
How is Capitalytics a Business Intelligence Company If It Just Graphs Call Report Data? (Hint: That's Not Close To All It Does)
Posted on Sun Jan 29, 2012Over the past four years that we have been talking with bankers, we have realized that banking is a business that is intrinsically linked to the ebbs and flows of a community. Successful bankers have been key focal points of their respective communities, whether they are the CEO of a $100 million bank, or the local President of a multi-billion dollar bank.
As such, we realized early that simply collecting FDIC call report data would not shed enough new light on a banker's questions about his/her business to be useful. Since our objective has always been to generate value for bankers in the form of actionable intelligence, mining as much information as possible about a local community and other relevant data, including knowledge about competitors that is presented in call reports, was something that we have always done.
For instance,
- Capitalytics collects localized employment, housing, labor force, and wage data (among other data) from the Bureau of Labor Statistics, Federal Reserve, FFIEC, and Bureau of Economic Analysis on a monthly basis; and the number of employers per business sector & size of employers from Cornell University.
- Capitalytics collects localized race, ethnic, rental, and age information from the FFIEC, and extrapolate short-term trends based on the history of an area.
- Capitalytics collects census tract data from the Census Bureau, and interpolates appropriate information based on information from the University of Missouri.
- Branch office and branch deposit information is provided by the FDIC, FFIEC, and geocoding is available from the University of Southern California.
In addition to these metrics,
- Capitalytics regularly collects swap curve rates, and rates for borrowing funds from the Federal Reserve Bureau.
- Yield curve data is collected from econstats.com on a weekly basis.
- Capitalytics collects the costs of several different commodoties which serve as economic predictors on a weekly basis.
- Aggregated business permits are collected from the Bureau of Labor Statistics regularly.
- Generate localized household data, including composition, work force, and average income
- Project growth rates for areas, both within a bank's footprint, as well as adjacent areas to identify areas of expansion or contraction
- Identify predictors that relate to a bank's deposits and late loan payments to help your bank expect what the future brings
- Run detailed portfolio simulations, accounting for expected market rate changes, to anticipate cash flows, derive interest rate and liquidity risk, and recommend instruments to purchase or divest
- Run custom reports, and account for localized conditions in projecting the performance of specific branches, or other organization units
Capitalytics is much more than simply a website for graphing call report data, and we are prepared to help your bank maximize its options and information resources. Contact Capitalytics now to see how we can help your bank.
Capitalytics Value Proposition for Banking Business Intelligence
Posted on Thu Jan 26, 2012As we have been continuing to work with banks, we have found that there is a gaping hole in providing effective and efficient Business Intelligence for community banks. Given our history at aggregating market and competitive intelligence, along with the custom analyses that we are providing for banks, we are re-asserting Capitalytics as one of the most complete and integrated offerings currently on the market.
We find ourselves with several key strategic benefits over other providers, including core systems, and BI offerings that cost orders of magnitude more than Capitalytics:
- Automated and immediate availability of current data (housing, employment, business, salary, deposits, and products) from a range of sources
- Operational metrics dashboard for your bank, allowing you to measure the productivity and profitability of your bank's organizational units and employees
- Actionable reports that consolidate issues into a "plain English" bullet list, starting with the issues that impact your bank the most
- A simulation engine built using state-of-the-art technology for forecasting and modeling your bank's cashflow based on your portfolio, allowing for cashflow forecasting, liquidity risk, interest rate risk, and a number of other applications
- A library of easily deployed & customizable reports that can be tailored to your bank's needs and culture (see here)
Our offering is a SaaS-based model, with systems housed on both coasts in SAS-70 certified datacenters, which means ...
- Lower costs, on the order of a full-time employee for the largest banks;
- 24/7 availability, with security options including whitelisted IP addresses for your bank, integration with your authentication management system (LDAP, Active Directory, and others), and/or password restrictions to accommodate your bank's policies;
- Immediate availability of our core offerings, and rapid deployment of unique custom solutions (typically days or hours);
- Immediate upgrades always available;
- No capital expenses for hardware; and,
- No onsite integration, upgrade, or end-of-life issues due to implementing our platform
We have rebooted our marketing, starting with the "What We Do" portion of our site. Contact us today so that we can help your bank operate as profitably as possible.
3Q11 FDIC Bank Data Available
Posted on Sun Dec 04, 2011We have uploaded the most recent banking industry data available. Please feel free to review the data as convenient.
2Q11 FDIC Bank Data Available
Posted on Tue Aug 23, 2011We have uploaded the most recent banking industry data available. Please feel free to review the data as convenient.
1Q11 FDIC Data Available
Posted on Tue May 24, 2011We have uploaded the most recent banking industry data available. Please feel free to review the data as convenient.
4Q10 FDIC Bank Data Available
Posted on Wed Feb 23, 2011We have uploaded the most recent banking industry data available. Please feel free to review the data as convenient.
3Q10 FDIC Bank Data Available
Posted on Wed Nov 24, 2010We have uploaded the most recent banking industry data available. Please feel free to review the data as convenient.
2010 Summary of Deposit Data Available
Posted on Tue Oct 12, 2010The latest SOD dataset is now integrated with Capitalytics site. Please feel free to review it at your convenience.
2Q10 FDIC Bank Data Available
Posted on Tue Aug 31, 2010We have uploaded the most recent banking industry data available. Please feel free to review the data as convenient.
Free Capitalytics Access for 30 Days with Survey Response
Posted on Tue Aug 03, 2010Capitalytics is aimed at distilling the multiple complex sources of information that are relevant to community bankers into manageable pieces of actionable advice. The tools that we make available address issues within community banks in both finance and marketing in the same way that finance and marketing roles of community banks are inter-related.
We are looking at new ways that we can serve our customer base. We are writing to ask for your help by completing a 10 question survey; your participation would be appreciated. All answers will be held in the strictest confidence, and would help with our tailoring our service to your needs. In exchange for completing this survey, we will automatically provide you with access to the Capitalytics system for 30 days. Our survey can be found here.
And, of course, any other feedback would be welcomed via our Contact page. Thanks for your participation!
New Relative Branch Value Report
Posted on Tue Jun 15, 2010We are pleased to announce the release of our latest reports for bankers, the Relative Branch Value Report. Using the total amount of deposits that a bank holds, the amount held at each branch office, and bank's market size & its market share, we are able to compute a score for each branch office that is a relative measure of the value of each branch to the overall bank.
Please contact us if you have any questions or suggestions for Capitalytics.
"Migration Analysis" of Banks, Part 2
Posted on Thu May 20, 2010In our previous post, we looked at how the capitalization of banks in the US, Alabama, and Georgia "evolved" over the past 10 years. In order to gauge how the behavior of the past three years has been anomalous, the following tables show the transition probabilities for the US, Alabama, and Georgia, respectively, divided over the periods from 2000-2006 and 2007-2009. The rows in these matrices show the "previous quarter's" capital category, as compared to the columns (that show the "following quarter's" capital category).
US (2000-2006 and 2007-2009)
| Well Capitalized | Adequately Capitalized | Under-Capitalized | Significantly Under-Capitalized | Critically Under-Capitalized | Not Found | |
|---|---|---|---|---|---|---|
| Well Capitalized | 99.1979% and 99.3969% | 0.2878% and 0.2053% | 0.0008% and 0.0000% | 0.0000% and 0.0000% | 0.0161% and 0.0344% | 0.4973% and 0.3635% |
| Adequately Capitalized | 40.3947% and 56.0516% | 56.3552% and 39.8810% | 0.0580% and 0.0000% | 0.0000% and 0.0000% | 1.4510% and 2.4802% | 1.7411% and 1.5873% |
| Under-Capitalized | 100.0000% and N/A | 0.0000% and N/A | 0.0000% and N/A | 0.0000% and N/A | 0.0000% and N/A | 0.0000% and N/A |
| Significantly Under-Capitalized | 40.0000% and 0.0000% | 0.0000% and 0.0000% | 0.0000% and 0.0000% | 0.0000% and 0.0000% | 40.0000% and 66.6667% | 20.0000% and 33.3333% |
| Critically Under-Capitalized | 10.1103% and 16.8853% | 7.3529% and 25.5562% | 0.0000% and 0.0000% | 0.0000% and 0.0000% | 78.6765% and 48.6024% | 3.8603% and 8.9561% |
AL (2000-2006 and 2007-2009, no banks ever found to be under-capitalized or significantly under-capitalized)
| Well Capitalized | Adequately Capitalized | Under-Capitalized | Significantly Under-Capitalized | Critically Under-Capitalized | Not Found | |
|---|---|---|---|---|---|---|
| Well Capitalized | 99.3975% and 99.6277% | 0.2728% and 0.0532% | 0.0000% and 0.0000% | 0.0000% and 0.0000% | 0.0000% and 0.0000% | 0.3297% and 0.3191% |
| Adequately Capitalized | 55.8140% and 62.5000% | 37.2093% and 25.0000% | 0.0000% and 0.0000% | 0.0000% and 0.0000% | 4.6512% and 0.0000% | 2.3256% and 12.5000% |
| Under-Capitalized | N/A | N/A | N/A | N/A | N/A | N/A |
| Significantly Under-Capitalized | N/A | N/A | N/A | N/A | N/A | N/A |
| Critically Under-Capitalized | 100.0000% and 42.8571% | 0.0000% and 14.2857% | 0.0000% and 0.0000% | 0.0000% and 0.0000% | 0.0000% and 28.5714% | 0.0000% and 14.2857% |
GA (2000-2006 and 2007-2009, no banks ever found to be significantly under-capitalized)
| Well Capitalized | Adequately Capitalized | Under-Capitalized | Significantly Under-Capitalized | Critically Under-Capitalized | Not Found | |
|---|---|---|---|---|---|---|
| Well Capitalized | 98.8575% and 99.1792% | 0.4958% and 0.3388% | 0.0108% and 0.0000% | 0.0000% and 0.0000% | 0.0216% and 0.0521% | 0.6144% and 0.4300% |
| Adequately Capitalized | 42.5339% and 62.5000% | 54.2986% and 32.0313% | 0.9050% and 0.0000% | 0.0000% and 0.0000% | 0.9050% and 3.1250% | 1.3575% and 2.3438% |
| Under-Capitalized | 100.0000% and N/A | 0.0000% and N/A | 0.0000% and N/A | 0.0000% and N/A | 0.0000% and N/A | 0.0000% and N/A |
| Significantly Under-Capitalized | N/A | N/A | N/A | N/A | N/A | N/A |
| Critically Under-Capitalized | 0.0000% and 16.9811% | 47.0588% and 35.8491% | 0.0000% and 0.0000% | 0.0000% and 0.0000% | 47.0588% and 33.9623% | 5.8824% and 13.2075% |
So what can we make out of all of these numbers? First, let's look carefully at the nationwide numbers, and we'll focus on pairs of transition probabilities that show significant differences between numbers in a given pair. These differences indicate that a change in behavior has occurred between the two windows of time that we're examining. The most notable pairs that grab attention are the recovery and dispositions of "Adequately Capitalized" banks. Nationwide, as well as in both of the states that we are examining, less time is being spent in this state, with a significant increase in the likelihood that these banks recover to being "Well Capitalized". Only in Alabama did the likelihood of a bank in this state end up either merging, being acquired, or dissolving. This would seem to be indicative of bank management being more responsive in realizing the issues associated with the current climate.
The other item to note is the recovery of "Critically Under-Capitalized"banks. While it is difficult to draw any significant conclusions in the case of Alabama (due to the small number of observations), Georgia has shown a significant reduction in the amount of time spent with a bank in this state; this general trend coincides with a similar trend nationwide, and is again likely due to the responsiveness of the regulators involved.
1Q10 FDIC Bank Data Available
Posted on Thu May 20, 2010We have uploaded the most recent banking industry data available. Please feel free to review the data as convenient.
"Migration Analysis" of Banks, Part 1
Posted on Thu May 20, 2010If you are in the banking space, you are familiar with one of Capitalytics' features: migration analysis. Migration Analysis entails building a model that shows the likelihood of a borrower letting a current loan lapse, or a late loan defaulting. In mathematical terms, this analysis involves determining the conditional probabilities of a loan's state transitioning from one state of delinquency to another.
The following analysis, though, is based on the state of bank's capitalization. In other words, we started looking at how banks migrate from one capital category to another. Banks are classified into one of five bank categories: "well capitalized", "adequately capitalized", "under-capitalized", "significantly under-capitalized", and "critically under-capitalized". The definitions of these categories are provided here by the FDIC. (For the purposes of this article, we used the 3% threshold for the leverage ratio condition in determining whether a bank is "adequately capitalized" or "under-capitalized". We also did not account for any confidential written orders written by the FDIC and imposed on a bank.)
In this study, we looked at not only the evolution of banks across the county, but also the evolution of banks across each of Alabama (which might be seen as a state that has weathered the latest banking issues fairly well) and Georgia (which might be seen as a one of the states that has been affected the most by the recent banking issues). We collected at the 40 quarters of data across the 2000's and looked at how every bank's capital category evolved from quarter-to-quarter. For instance, in the state of Alabama, during the 40 quarters from 1Q2000 to 4Q2009, there were 52 instances during which a bank's capital category went from "well capitalized" to "adequately capitalized", and 82 instances during which a bank ceased doing business after being found to be "well capitalized" (due to, most likely, dissolution, merger, or acquisition).
The following tables show the transition probabilities for the US, Alabama, and Georgia, respectively. The rows in these matrices show the "previous quarter's" capital category, as compared to the columns (that show the "following quarter's" capital category).
US
| Well Capitalized | Adequately Capitalized | Under-Capitalized | Significantly Under-Capitalized | Critically Under-Capitalized | Not Found | |
|---|---|---|---|---|---|---|
| Well Capitalized | 99.2546% | 0.2643% | 0.0006% | 0.0000% | 0.0213% | 0.4592% |
| Adequately Capitalized | 46.1736% | 50.2746% | 0.0366% | 0.0000% | 1.8308% | 1.6844% |
| Under-Capitalized | 100.0000% | 0.0000% | 0.0000% | 0.0000% | 0.0000% | 0.0000% |
| Significantly Under-Capitalized | 33.3333% | 0.0000% | 0.0000% | 0.0000% | 33.3333% | 33.3333% |
| Critically Under-Capitalized | 14.2907% | 18.5850% | 0.0000% | 0.0000% | 60.1197% | 7.0046% |
AL (no banks ever found to be under-capitalized or significantly under-capitalized)
| Well Capitalized | Adequately Capitalized | Under-Capitalized | Significantly Under-Capitalized | Critically Under-Capitalized | Not Found | |
|---|---|---|---|---|---|---|
| Well Capitalized | 99.4664% | 0.2071% | 0.0000% | 0.0000% | 0.0000% | 0.3265% |
| Adequately Capitalized | 57.6271% | 33.8983% | 0.0000% | 0.0000% | 3.3898% | 5.0847% |
| Under-Capitalized | N/A | N/A | N/A | N/A | N/A | N/A |
| Significantly Under-Capitalized | N/A | N/A | N/A | N/A | N/A | N/A |
| Critically Under-Capitalized | 50.0000% | 12.5000% | 0.0000% | 0.0000% | 25.0000% | 12.5000% |
GA (no banks ever found to be significantly under-capitalized)
| Well Capitalized | Adequately Capitalized | Under-Capitalized | Significantly Under-Capitalized | Critically Under-Capitalized | Not Found | |
|---|---|---|---|---|---|---|
| Well Capitalized | 98.9516% | 0.4498% | 0.0076% | 0.0000% | 0.0305% | 0.5604% |
| Adequately Capitalized | 53.2495% | 42.3480% | 0.4193% | 0.0000% | 2.0964% | 1.8868% |
| Under-Capitalized | 100.0000% | 0.0000% | 0.0000% | 0.0000% | 0.0000% | 0.0000% |
| Significantly Under-Capitalized | N/A | N/A | N/A | N/A | N/A | N/A |
| Critically Under-Capitalized | 15.7205% | 36.6812% | 0.0000% | 0.0000% | 34.9345% | 12.6638% |
Before going any further, we must note that examining this system as a Markov chain entails certain assumptions, which are not even close to being met in this "real world" scenario. First, while randomness may appear be observed from the outside of the system, we can only hope that the management of the 10,000+ banks in the US are not actually making operational decisions such that their banks move through this system with truly random transitions. Second, changes in the economic climate will surely have an impact on the factors which govern these banks. (We will examine one time-varying aspect of this system in the following post.) Third, but not finally, we should keep in mind that the goal of this study will be to evaluate intuitively (not in any academically rigorous fashion) if Alabama's and Georgia's banks, respectively, are obviously traversing this system in a different manner than an arbitrary bank in the US, and, if there has been any change in these states' banks' behavior since the current economic crisis began.
What conclusions can be reached from the above data? Obviously, there are not enough instances of banks being classified as "Under-Capitalized" or "Significantly Under-Capitalized" in either Alabama or Georgia to be able to draw any conclusions. However, at least looking at the data superficially, a few things become obvious: first, Alabama's banks seem to avoid the "Critically Under-Capitalized" situation (which requires government intervention) much better than the general norm; gleaning that the threshold for this classification is driven based on the ratio of equity to asset values implies that Alabama's banks likely have tended to grow in a more controlled fashion than their counterparts.
Beyond this point, we can see that banks in both Alabama and Georgia tend to recover from being classified as "Adequately Capitalized" faster than banks across the country (based on the lower transition probability from the "Adequately Capitalized" state back to itself). Admittedly, in Alabama, it is more significantly more likely for an "Adequately Capitalized" bank slips into a "Critically Under-Capitalized" state than average (twice as likely, in fact), but it is also much more likely for this same "Adequately Capitalized" bank to recover by adjusting its operations in order to boost its key ratios. This last point (regarding the potential for a bank to recover) also applies to Georgia banks.
What else can be said about banks in these two states versus the norm? The main other point that stands out is the apparent disposition of Georgia banks once they reach a state of being a "Critically Under-Capitalized" bank; these banks appear to reach their final disposition (either recovery or, more likely, otherwise) more quickly than in other states, which is more a credit to the efforts of the regulatory agencies that operate in that state. The next questions to be addressed, however, is how much of these numbers have been tainted by the issues that have affected bank in the US, and both state, over the past few years. Our next post will address this question.Evolution of Well-Capitalized Banks in Alabama and Georgia
Posted on Wed Apr 28, 2010Inkeeping with yesterday's post, the following table show how the number of banks that are "Well Capitalized" evolved over the past ten years in Alabama and Georgia, respectively. Given the high numbers below, it shines some light on the cultural effects within the banking community as a whole.
Alabama Banks
| Date | Total Number of Banks | Number of "Well Capitalized" Banks | Percentage of Banks that are "Well Capitalized" | Total Deposits of all Banks based in AL (6/2009 adjusted $) |
|---|---|---|---|---|
| 2000-03-31 | 338 | 338 | 100.00000% | |
| 2000-06-30 | 340 | 340 | 100.00000% | $124.0B ($155.2B) |
| 2000-09-30 | 340 | 340 | 100.00000% | |
| 2000-12-31 | 340 | 336 | 98.82353% | |
| 2001-03-31 | 340 | 338 | 99.41176% | |
| 2001-06-30 | 338 | 336 | 99.40828% | $126.6B ($153.4B) |
| 2001-09-30 | 340 | 340 | 100.00000% | |
| 2001-12-31 | 340 | 336 | 98.82353% | |
| 2002-03-31 | 336 | 332 | 98.80952% | |
| 2002-06-30 | 328 | 326 | 99.39024% | $126.9B ($152.1B) |
| 2002-09-30 | 328 | 322 | 98.17073% | |
| 2002-12-31 | 326 | 320 | 98.15951% | |
| 2003-03-31 | 322 | 316 | 98.13665% | |
| 2003-06-30 | 322 | 320 | 99.37888% | $135.9B ($159.6B) |
| 2003-09-30 | 324 | 324 | 100.00000% | |
| 2003-12-31 | 324 | 324 | 100.00000% | |
| 2004-03-31 | 326 | 326 | 100.00000% | |
| 2004-06-30 | 326 | 326 | 100.00000% | $145.1B ($165.0B) |
| 2004-09-30 | 328 | 326 | 99.39024% | |
| 2004-12-31 | 328 | 328 | 100.00000% | |
| 2005-03-31 | 320 | 320 | 100.00000% | |
| 2005-06-30 | 320 | 318 | 99.37500% | $146.8B ($162.8B) |
| 2005-09-30 | 318 | 316 | 99.37107% | |
| 2005-12-31 | 322 | 322 | 100.00000% | |
| 2006-03-31 | 318 | 318 | 100.00000% | |
| 2006-06-30 | 320 | 320 | 100.00000% | $160.2B ($170.3B) |
| 2006-09-30 | 320 | 320 | 100.00000% | |
| 2006-12-31 | 318 | 318 | 100.00000% | |
| 2007-03-31 | 322 | 320 | 99.37888% | |
| 2007-06-30 | 320 | 320 | 100.00000% | $160.2B ($165.8B) |
| 2007-09-30 | 318 | 318 | 100.00000% | |
| 2007-12-31 | 320 | 320 | 100.00000% | |
| 2008-03-31 | 324 | 324 | 100.00000% | |
| 2008-06-30 | 320 | 320 | 100.00000% | $172.4B ($169.9B) |
| 2008-09-30 | 318 | 316 | 99.37107% | |
| 2008-12-31 | 314 | 310 | 98.72611% | |
| 2009-03-31 | 312 | 310 | 99.35897% | |
| 2009-06-30 | 312 | 306 | 98.07692% | $185.5B ($185.5B) |
| 2009-09-30 | 306 | 302 | 98.69281% | |
| 2009-12-31 | 304 | 298 | 98.02632% |
Georgia Banks
| Date | Total Number of Banks | Number of "Well Capitalized" Banks | Percentage of Banks that are "Well Capitalized" | Total Deposits of all Banks based in GA (6/2009 adjusted $) |
|---|---|---|---|---|
| 2000-03-31 | 730 | 714 | 97.80822% | |
| 2000-06-30 | 736 | 718 | 97.55435% | $115.6B ($144.7B) |
| 2000-09-30 | 724 | 706 | 97.51381% | |
| 2000-12-31 | 722 | 706 | 97.78393% | |
| 2001-03-31 | 722 | 704 | 97.50693% | |
| 2001-06-30 | 708 | 696 | 98.30508% | $122.5B ($148.5B) |
| 2001-09-30 | 708 | 690 | 97.45763% | |
| 2001-12-31 | 694 | 674 | 97.11816% | |
| 2002-03-31 | 700 | 694 | 99.14286% | |
| 2002-06-30 | 694 | 686 | 98.84726% | $115.5B ($138.5B) |
| 2002-09-30 | 698 | 694 | 99.42693% | |
| 2002-12-31 | 682 | 670 | 98.24047% | |
| 2003-03-31 | 686 | 682 | 99.41691% | |
| 2003-06-30 | 680 | 678 | 99.70588% | $126.9B ($149.0B) |
| 2003-09-30 | 684 | 678 | 99.12281% | |
| 2003-12-31 | 690 | 682 | 98.84058% | |
| 2004-03-31 | 692 | 684 | 98.84393% | |
| 2004-06-30 | 694 | 686 | 98.84726% | $135.6B ($154.2B) |
| 2004-09-30 | 694 | 692 | 99.71182% | |
| 2004-12-31 | 688 | 684 | 99.41860% | |
| 2005-03-31 | 688 | 676 | 98.25581% | |
| 2005-06-30 | 692 | 684 | 98.84393% | $171.8B ($190.5B) |
| 2005-09-30 | 694 | 692 | 99.71182% | |
| 2005-12-31 | 698 | 694 | 99.42693% | |
| 2006-03-31 | 684 | 680 | 99.41520% | |
| 2006-06-30 | 706 | 702 | 99.43343% | $194.9B ($207.1B) |
| 2006-09-30 | 712 | 708 | 99.43820% | |
| 2006-12-31 | 704 | 698 | 99.14773% | |
| 2007-03-31 | 704 | 702 | 99.71591% | |
| 2007-06-30 | 708 | 702 | 99.15254% | $197.5B ($204.4B) |
| 2007-09-30 | 700 | 700 | 100.00000% | |
| 2007-12-31 | 704 | 700 | 99.43182% | |
| 2008-03-31 | 714 | 696 | 97.47899% | |
| 2008-06-30 | 708 | 684 | 96.61017% | $201.6B ($198.7B) |
| 2008-09-30 | 678 | 652 | 96.16519% | |
| 2008-12-31 | 668 | 622 | 93.11377% | |
| 2009-03-31 | 656 | 608 | 92.68293% | |
| 2009-06-30 | 648 | 576 | 88.88889% | $207.7B ($207.7B) |
| 2009-09-30 | 626 | 542 | 86.58147% | |
| 2009-12-31 | 610 | 506 | 82.95082% |
Ranking of States by Percentage of Banks That Are Well-Capitalized
Posted on Tue Apr 27, 2010Based on the latest information from the FDIC (dated December 31, 2009), the following table shows the percentage of banks based in each state that are categorized as "Well Capitalized". The criteria for a bank to be "Well Capitalized" is a total risk-based capital ratio of 10.0 percent or greater; a Tier 1 risk-based capital ratio of 6.0 percent or greater; a leverage ratio of 5.0 percent or greater; and not being subject to any order or other directive. (The following map and table containing detailed numbers do not account for such orders.)
| State | Percentage |
|---|---|
| AK | 100 % |
| VT | 100 % |
| ND | 100 % |
| RI | 100 % |
| NH | 100 % |
| WV | 100 % |
| WY | 100 % |
| DE | 100 % |
| OK | 100 % |
| TX | 100 % |
| KY | 99 % |
| LA | 99 % |
| IN | 99 % |
| NE | 99 % |
| TN | 99 % |
| MS | 99 % |
| IA | 99 % |
| SD | 99 % |
| MT | 99 % |
| CO | 99 % |
| AR | 99 % |
| NJ | 98 % |
| OH | 98 % |
| VA | 98 % |
| MO | 98 % |
| MA | 98 % |
| NC | 98 % |
| AL | 98 % |
| PA | 97 % |
| KS | 97 % |
| CT | 96 % |
| WI | 96 % |
| IL | 96 % |
| MN | 96 % |
| NY | 95 % |
| MD | 94 % |
| ME | 93 % |
| CA | 93 % |
| NM | 93 % |
| UT | 92 % |
| SC | 92 % |
| HI | 89 % |
| ID | 89 % |
| MI | 87 % |
| AZ | 86 % |
| FL | 85 % |
| DC | 83 % |
| GA | 83 % |
| OR | 81 % |
| WA | 80 % |
| NV | 78 % |
New Comparative Loan Loss Reports
Posted on Tue Apr 27, 2010Based on input from one of our partners, we are proud to announce that we have deployed our "Comparative Loan Loss Report". This report shows a bank's loan losses for each type of loan, the evolution of those losses, and a comparison between those losses and the bank's loan loss allowance. This information is provided not only for the user's bank, but also, for comparison purposes, a custom built group of banks.
Please contact us if you have any suggestions for data that we can provide.
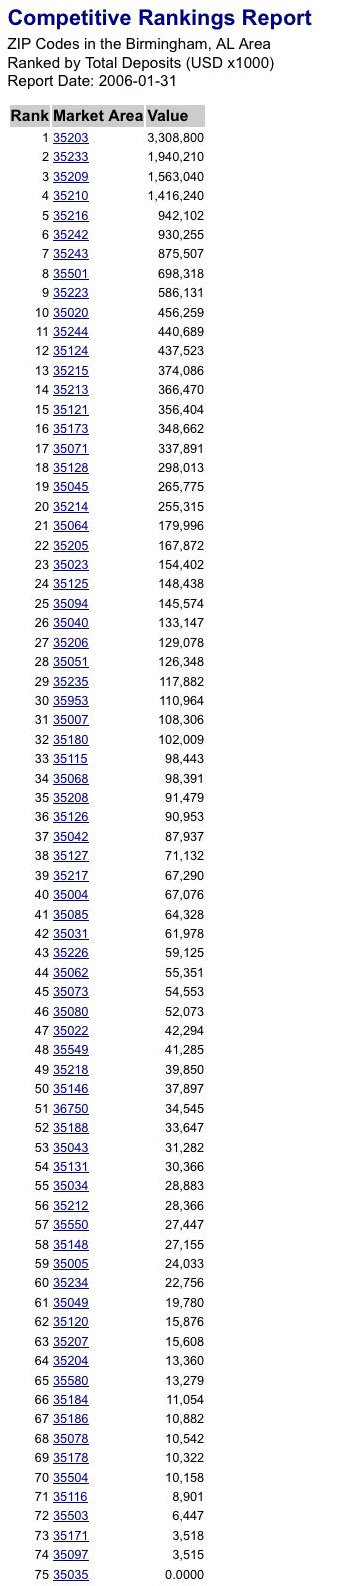
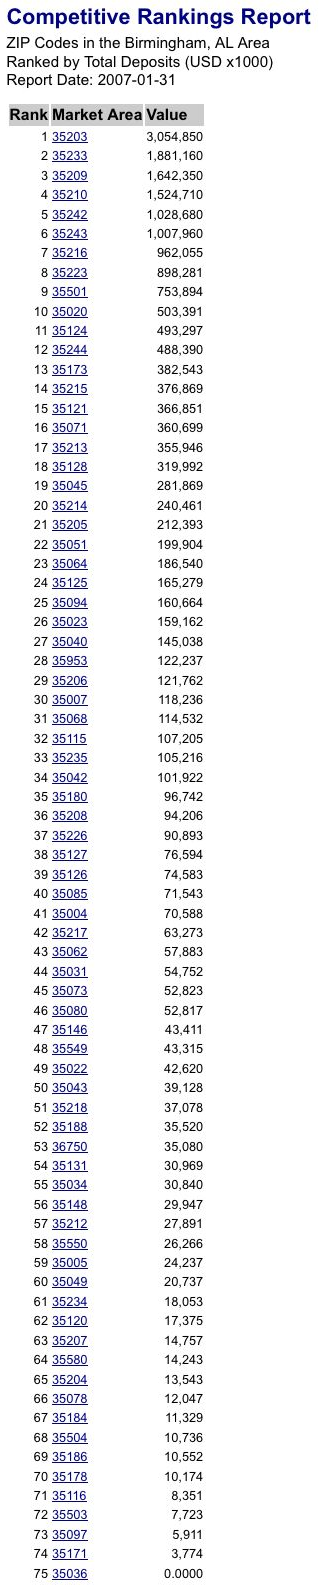
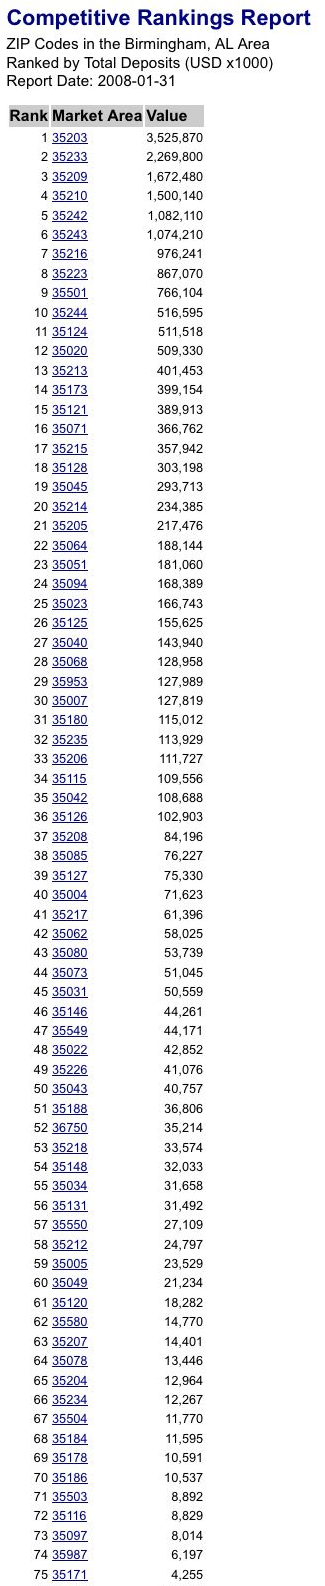
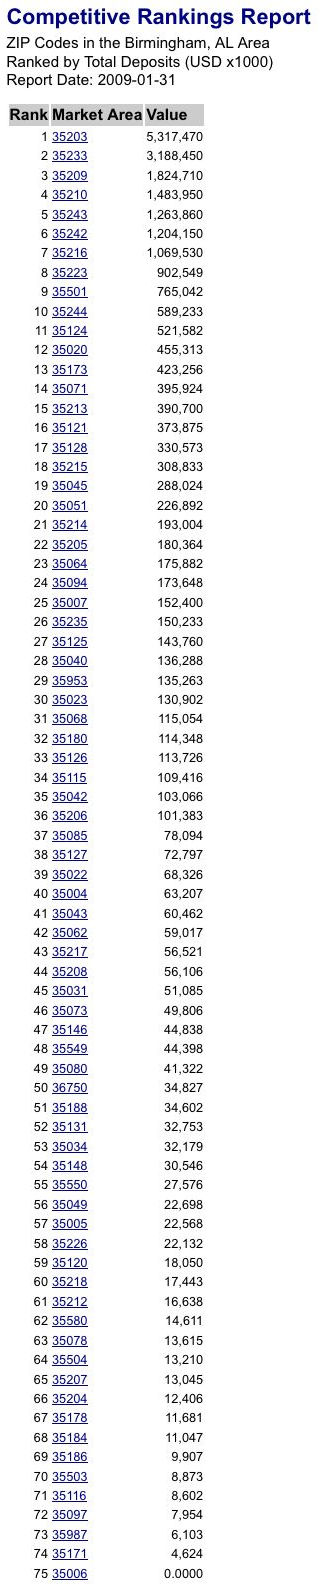
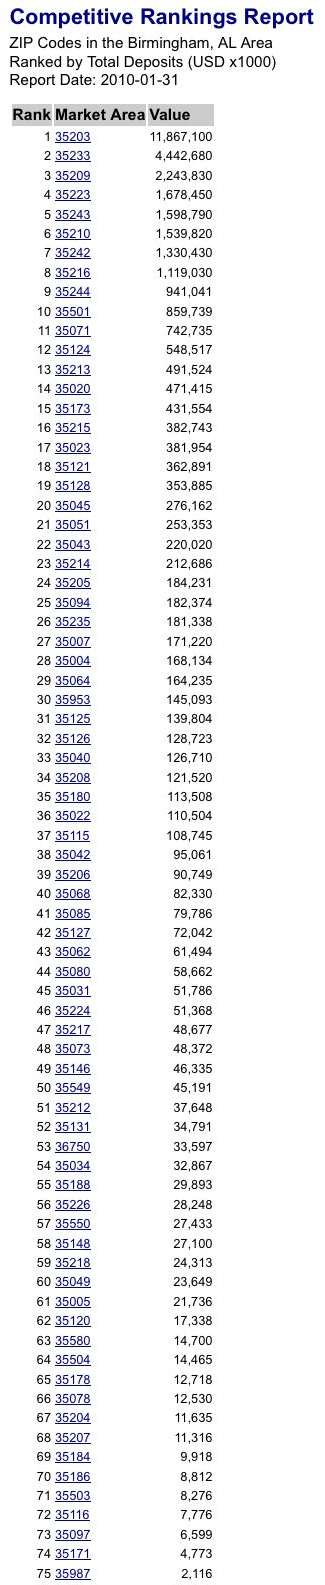
Following up on Birmingham Deposits
Posted on Mon Mar 29, 2010Following up on our previous post, we have collected the deposits per zip code within the Birmingham metro area from January of each year from 2006 to 2010. Two interesting points come out: first, there was a notable slight dip in deposits during 2006, likely when depositors were investing their money in other, less conservative areas. Second, and more interestingly, from a glance, it is obvious that depositors are providing an amazing amount of deposits to their respective institutions over the past year; in fact, during 2009, only 5 out of 75 of the zip codes shown have decreased the amount of their deposits, and those decreases were extremely slight.
The following table lists the deposits per zip code for the 75 most dominant zip codes in Birmingham for January of 2010, 2009, 2008, 2007, and 2006.
 |
 |
 |
 |
 |
New SWOT Report
Posted on Sat Mar 27, 2010To give a better view of the implications of all of the information that we at Capitalytics are collecting, we are proud to announce the release of a new SWOT (Strengths-Weaknesses-Opportunities-Threats) Report. This report is found under "My Bank", and is available for your bank based on public and proprietary information that Capitalytics has available. It includes not only some of the information that is currently available as part of our "Regulatory Issues", but it also highlights growing and declining markets in which a bank has currently invested, growing and declining businesses in sectors within those areas, and recommendations for markets into which a bank may be growing. It also includes detailed demographic information on the markets in which your bank currently has a presence.
If you have any questions or thoughts about our features, please don't hesitate to contact us.
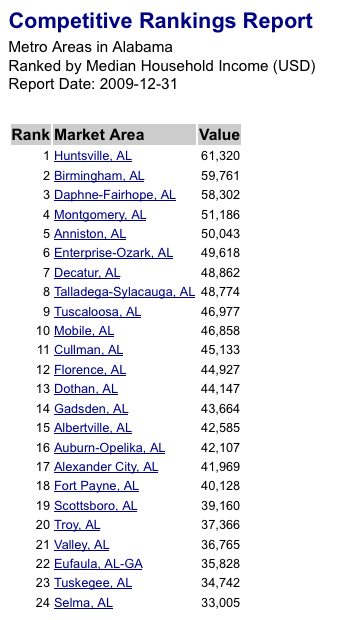
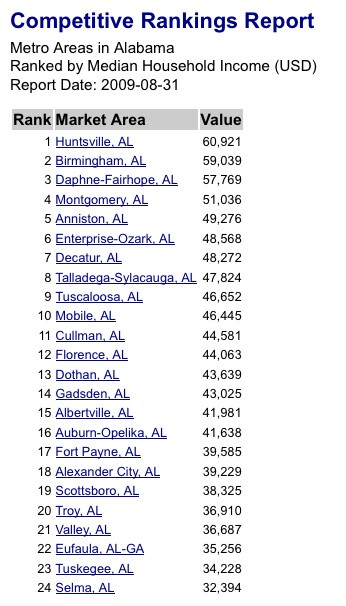
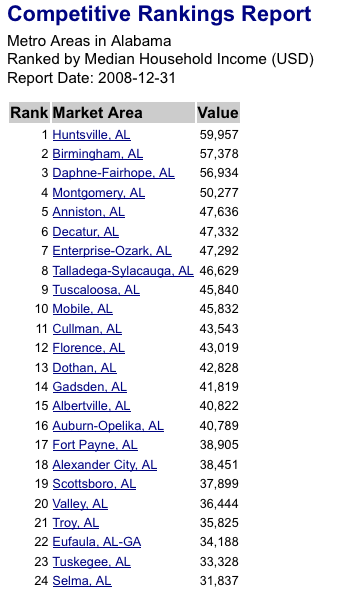
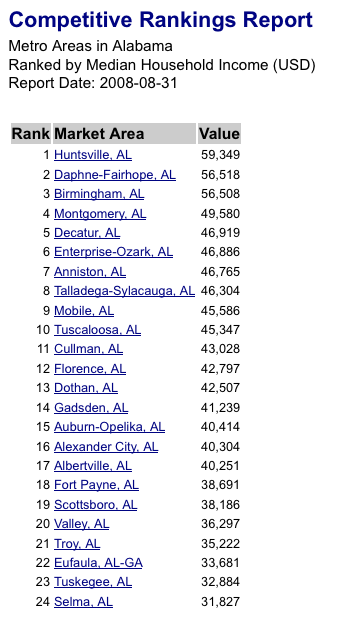
Following up on Alabama MSAs by Household Income
Posted on Fri Mar 26, 2010Inkeeping with our previous series, the following tables show the Household Income for MSAs in the state of Alabama at the end of August 2008, December 2008, August 2009, and now December 2009 (shown in the opposite order below). During 2009, we saw an average increase in the number of households of 0.872% per MSA, and an average increase in the median household income of 3.20% per MSA. Growth over the year has varied from 0.96% in Valley; and 1.87% in Scottsboro; to over 4% in Tuskegee (4.01%); Birmingham (4.1%); Albertville (4.1%); Enterprise-Ozark (4.1%); Gadsden (4.2%); Troy (4.3%); Eufala (4.5%); and Anniston (4.9%). Notice that the overall annualized rate from August-to-August is slightly higher than December-to-December, indicating a slow-down in progress in the latter portion of 2009 as compared to late 2008. Also, it should be noted that the consumer price index went from 218.783 at the end of August 2008, to 211.143 at year-end 2008, to 215.969 at the end of August 2009, and 216.687 at year-end 2009 (an increase of 2.63% during 2009).
The following table lists the MSAs in Alabama, sorted by estimated Household Income as of year-end 2009, August 2009, year-end 2008, and August 2008.
 |
 |
 |
 |
New Demographic Analyses
Posted on Wed Mar 03, 2010We are pleased to release our latest set of demographic analyses, found as a bullet on our Capitalytics Dashboard's "Regulatory Issues", "Market Strengths", and "Market Weaknesses" panels. On the "Regulatory Issues" panel, a new bullet entitled "Demographics Served" provides insights into the overall demographics where your bank has a presence, including households, population, unemployment, and market share. On the "Market Strengths" and "Market Weaknesses" panels, we highlight the number of areas (zip codes, counties, or states, as most appropriate) in which your bank has a presence, along with identifying which area(s) is(are) the strongest or weakest, based on market share, deposits, and deposits per capita.
Please let us know if you have any suggestions or comments about our features.
New Look and 4Q09 Data Available
Posted on Wed Feb 24, 2010We are pleased to debut our new look to the website; please contact us if you have any questions, problems, or thoughts for improvement.
Also, we have uploaded the most recent banking industry data available. Please feel free to review the data as convenient for you.
New PDFs and Correlation Benchmarks
Posted on Tue Feb 16, 2010We are happy to announce that we have added the capability to download many of our graphs of bank and market performance as PDFs. Our Liquidity and Asset Performance Reports can also be downloaded as PDFs.
On a separate note, we have also added three new market metrics to use as potential predictor functions for bank deposits and defaulted loans: specifically, we have added prices for gasoline (average across all formulations across the US); natural gas (as reported at Henry Hub, LA); and crude oil (as reported from West Texas). In cases where it is appropriate, we will note on the Executive Summary for your bank if any of these measures, or others that Capitalytics analyzes, are good indicators of future deposits or charge offs at your bank.
Please contact us if you have any questions or suggestions about Capitalytics.
New Data for Audits
Posted on Sun Feb 14, 2010We are pleased to debut our latest reports that are aimed at helping banks with audits of their compliance with the Community Reinvestment Act. Available under "My Bank", the "CRA/ECOA Audit Report" currently lists all of the relevant demographic, income, and geographic from various sources for the census tracts in which your bank has a branch office presence. It also provides a chart of the loan-to-deposit ratio for your bank, and we are planning to add additional information based on the size of your bank very soon. Additionally, provided that Capitalytics has access to your bank's loan data, we can build reports on the amount of funds that are deployed in each area. This feature is in conjunction with our new Asset Quality Analysis, which is highlighted in our new brochure.
Please contact us if we can help deploy this valuable feature for your bank.
New Brochures
Posted on Mon Feb 08, 2010We are pleased to announce that we have posted two new brochures that describe the capabilities of our systems. A one page brochure of highlights, and a more detailed, two-page brochure, can be downloaded from here and here, respectively.
Please contact us if you have any questions or suggestions.
New Menus
Posted on Fri Feb 05, 2010We are pleased to announce that, based on feedback from several users, we have revised and updated our menu panel to provide direct access to relevant reports for a user's bank. Please feel free to contact us if you have any feature suggestions that you would like to see on Capitalytics site.
Market Data as of November 2009
Posted on Wed Jan 27, 2010We are pleased to announce that our market data has been updated to November 2009.
Deposit Distribution in Detroit, MI; Austin, TX; and Boston, MA
Posted on Thu Dec 24, 2009The following tables show the distribution of deposits in branch offices across as many as 99 zip codes in three U.S. cities: Detroit, MI; Austin, TX; and Boston, MA. All three cities are listed as of year-end 2007, as well as at the end of August 2009.
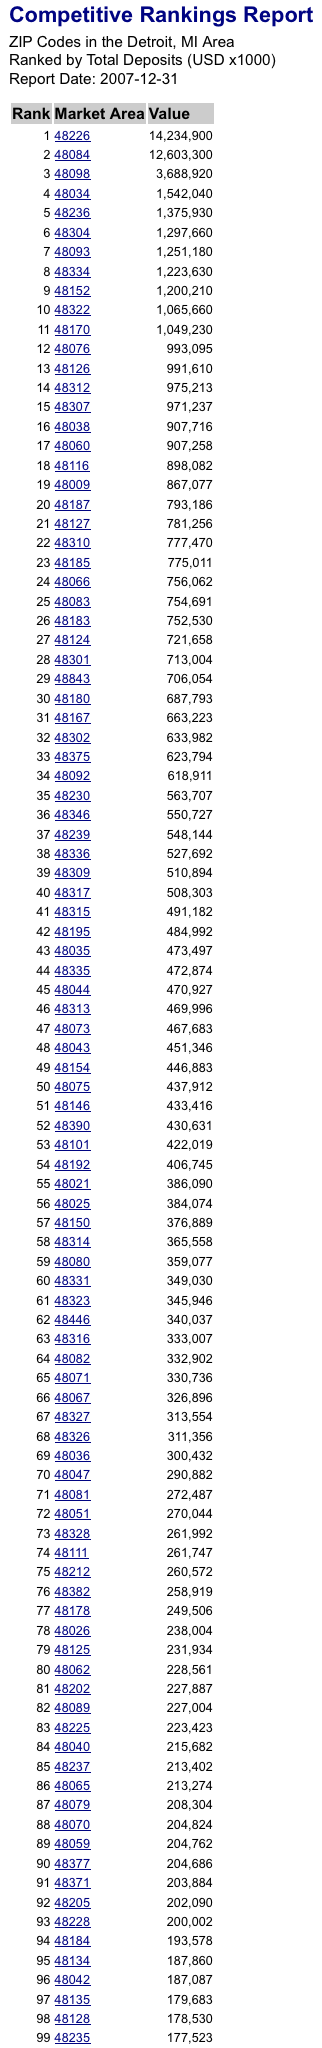 |
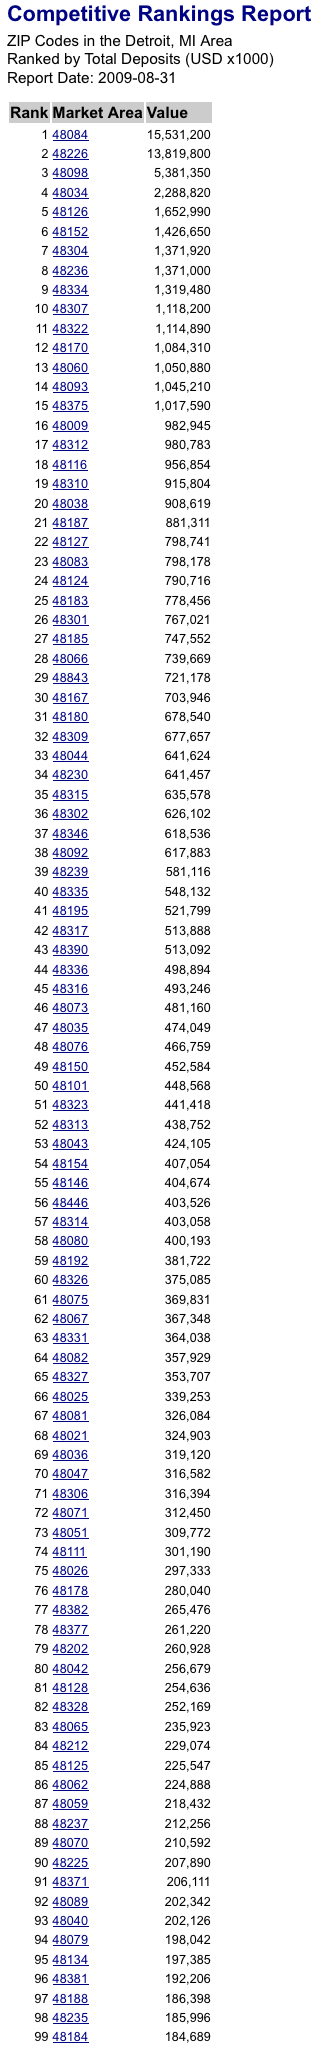 |
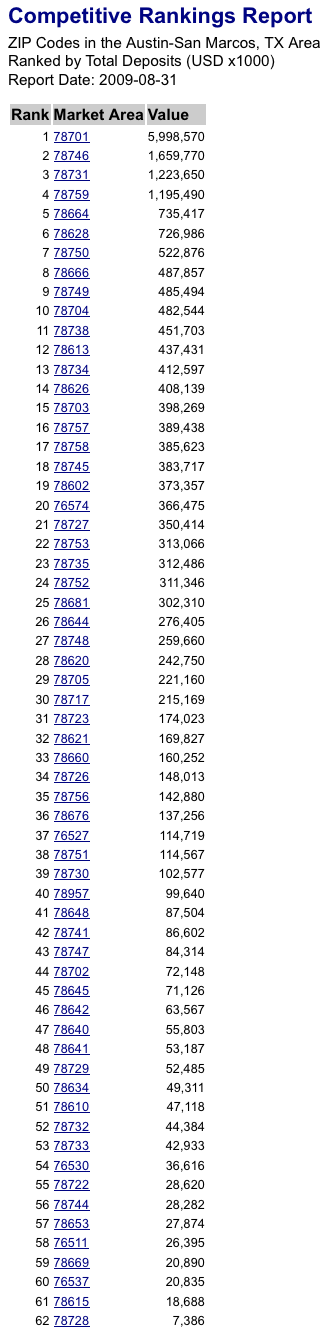 |
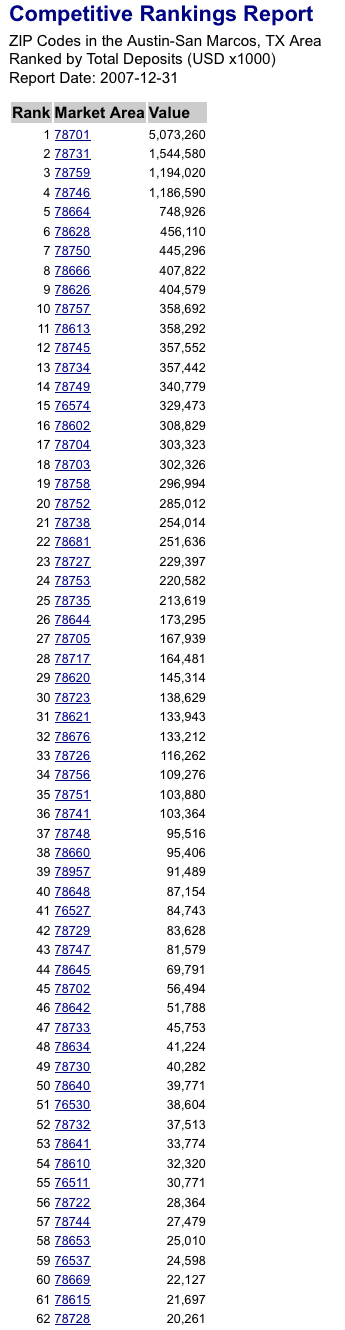 |
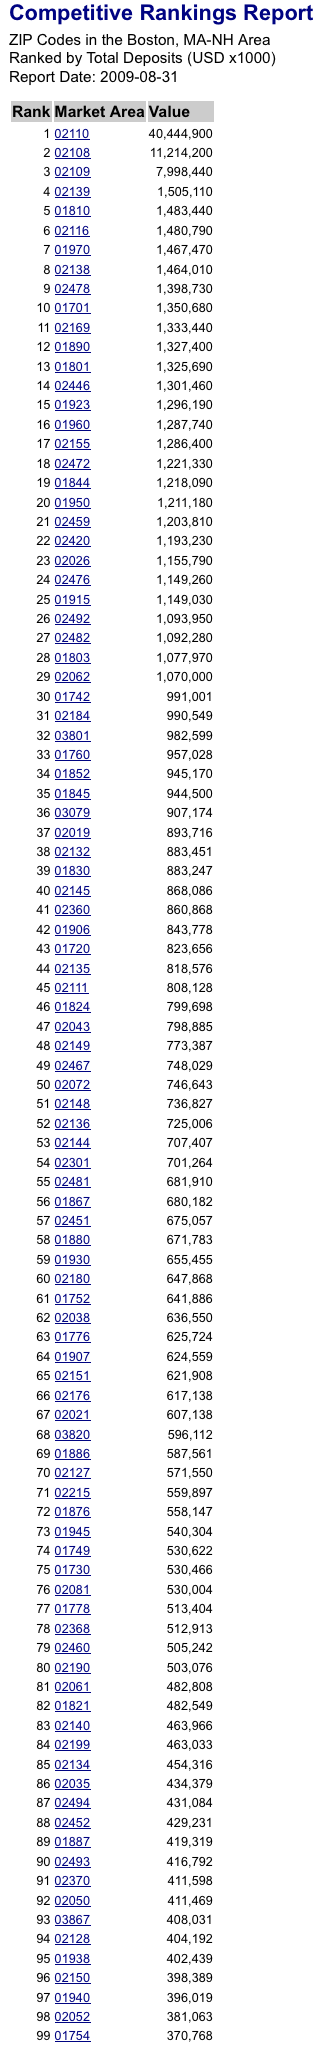 |
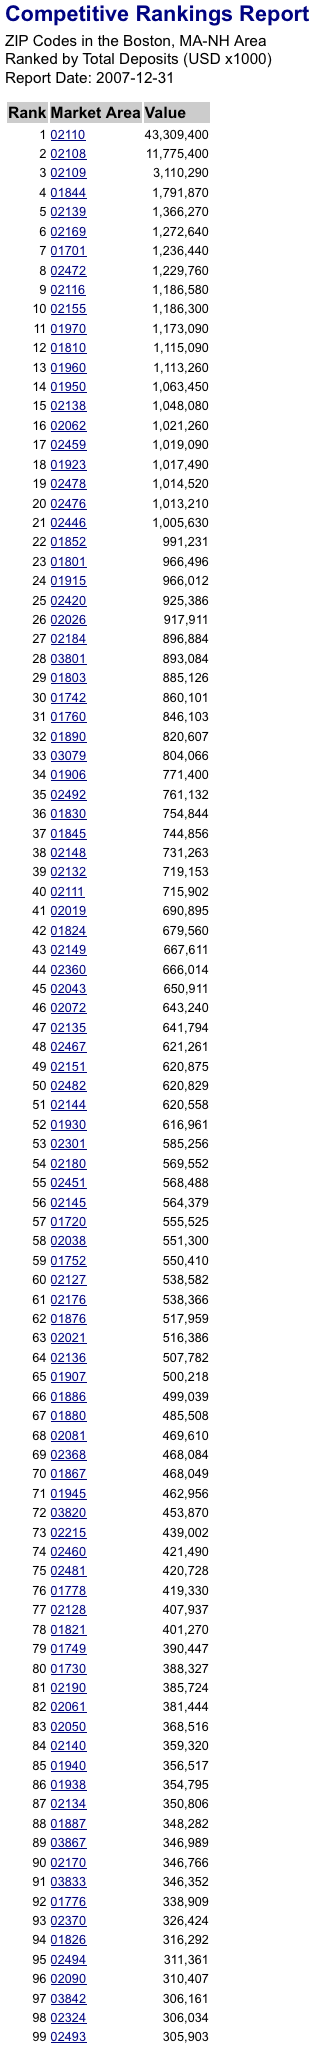 |
Deposit Distribution in Memphis, TN; Jackson, MS; and Atlanta, GA
Posted on Wed Dec 23, 2009The following tables show the distribution of deposits in branch offices across zip codes in three Southeastern cities: Memphis, TN; Jackson, MS; and Atlanta, GA. (In the case of Atlanta, we only listed the top 99 zip codes.) All three cities are listed as of year-end 2007, as well as at the end of August 2009.
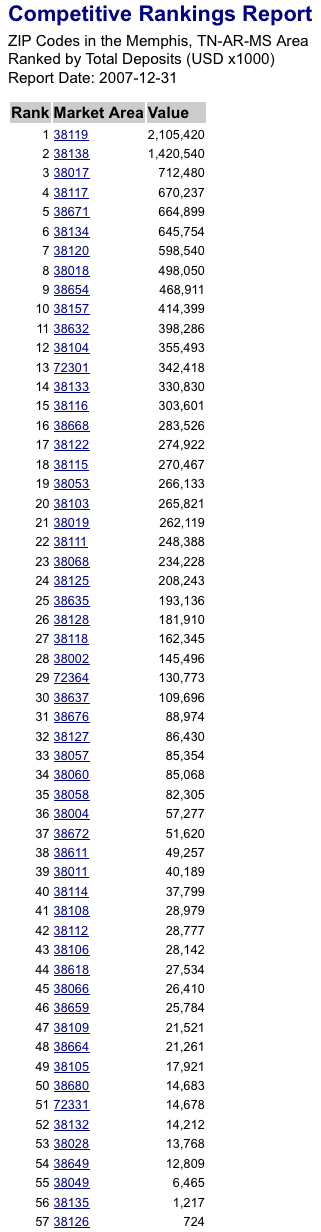 |
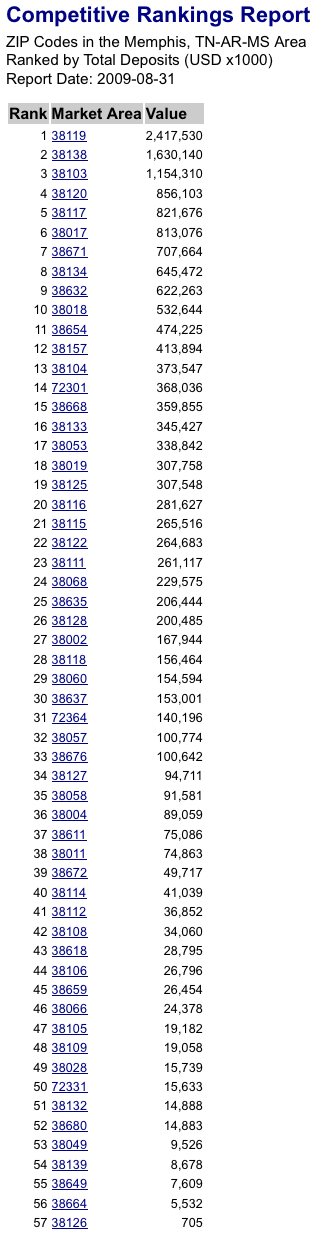 |
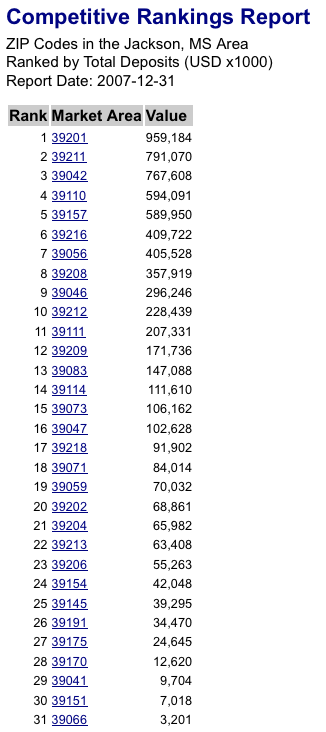 |
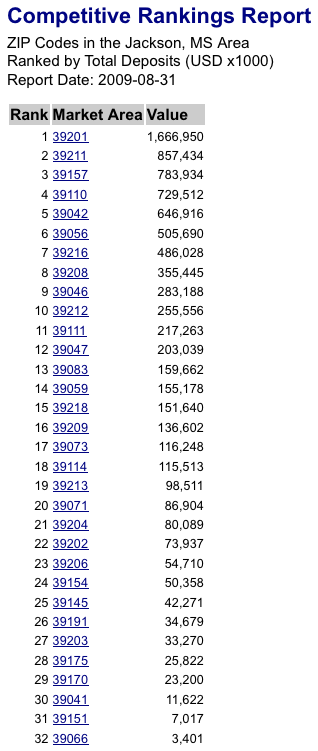 |
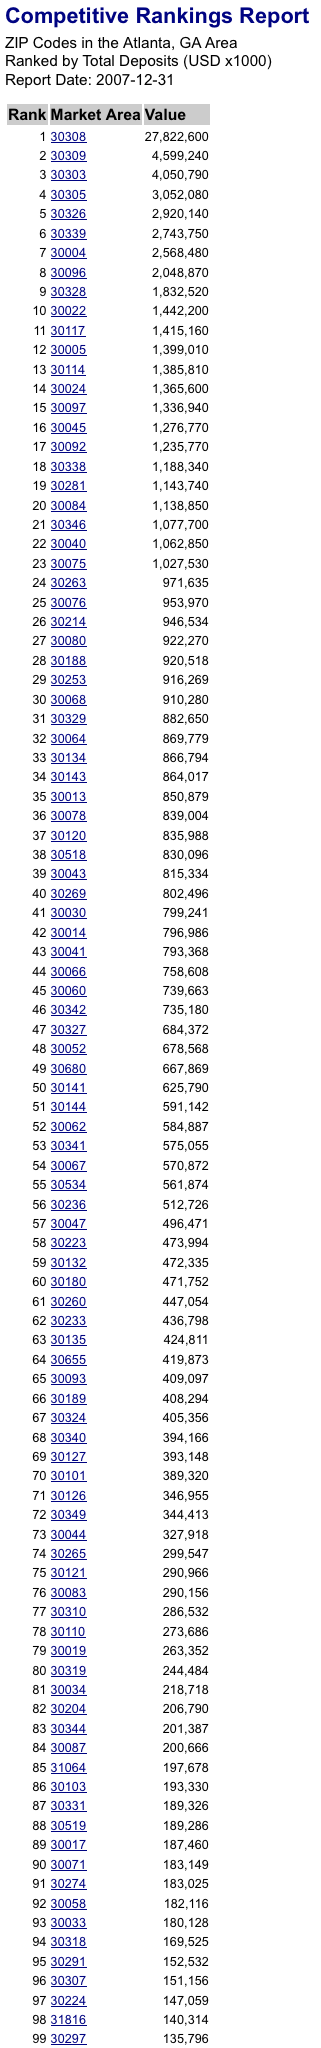 |
 |
Median Efficiency Ratios per Asset Class
Posted on Sat Dec 19, 2009In a previous post, we highlighted the Median Efficiency Ratio across states in the US, and how those values have unfolded over the past 8 quarters. Using the data available for Q4 of 2006 and Q3 of 2009, we present the Median Efficiency Ratio for each of the shown Asset Classes below. Notice that, in some of the diagrams, states are shown in white and have values that are outside of the identified ranges; secondary diagrams are provided on the far left and right to illustrate those states' values.
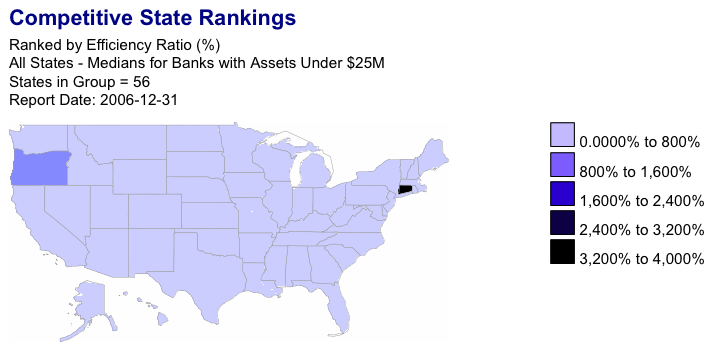 | 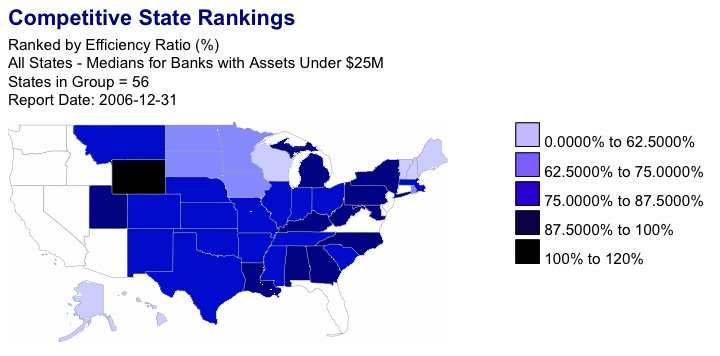 | 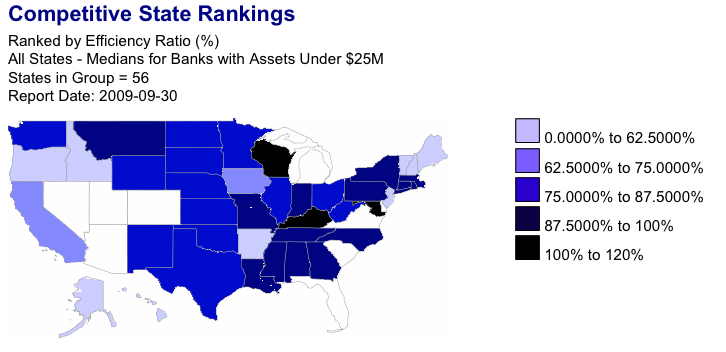 | 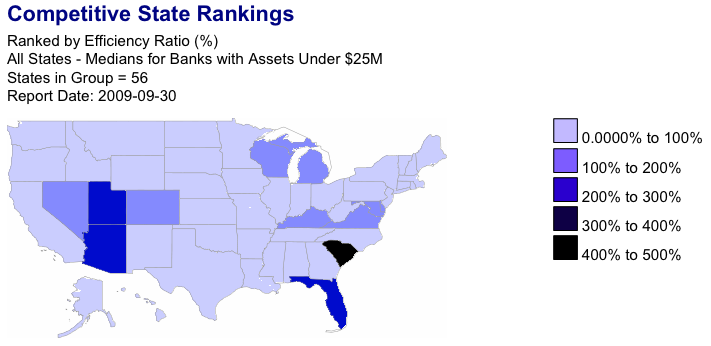 |
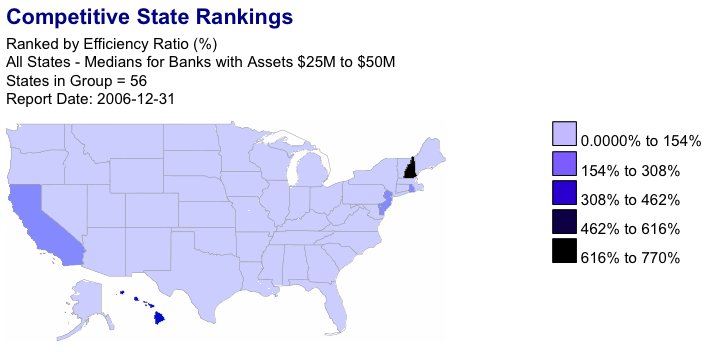 | 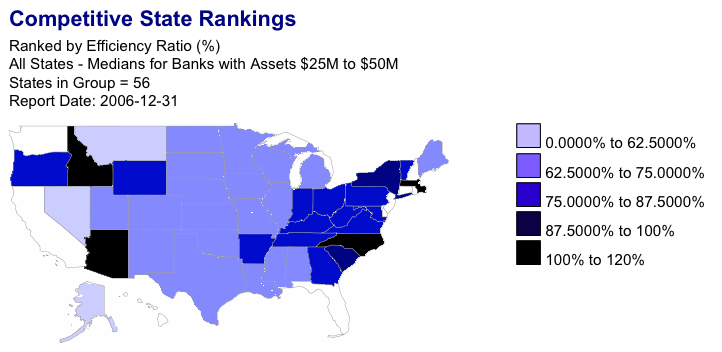 | 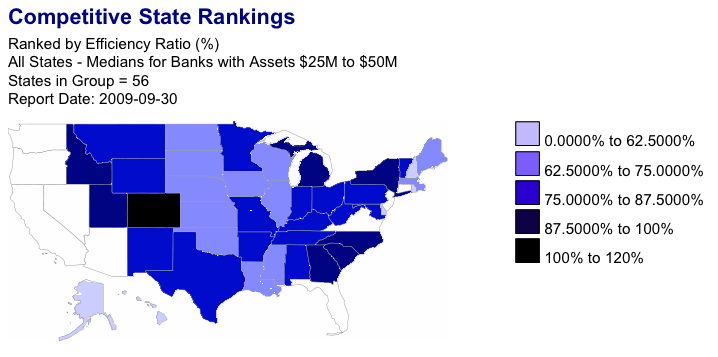 | 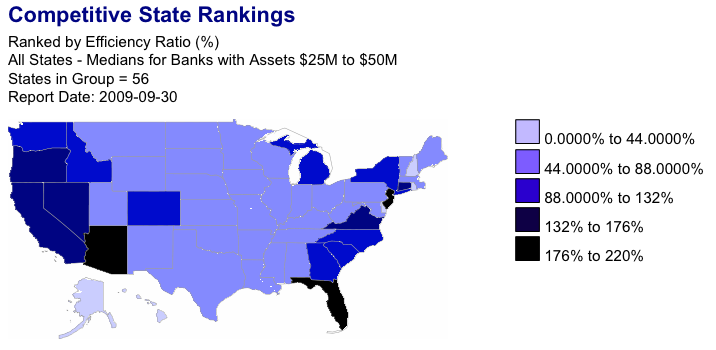 |
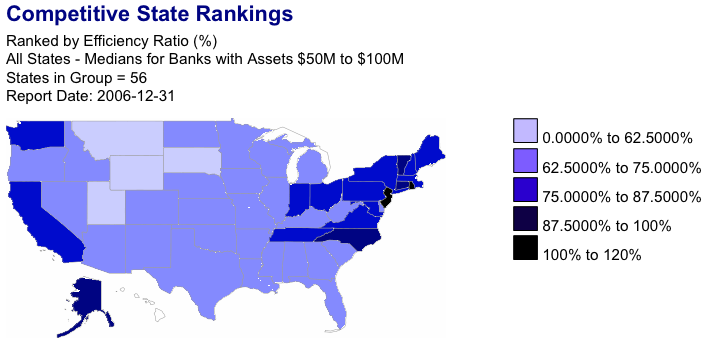 | 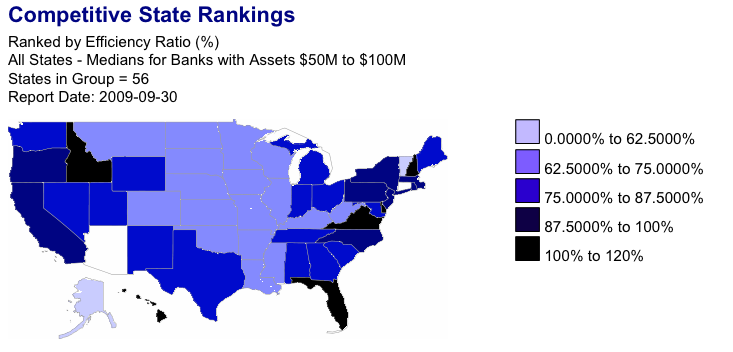 | 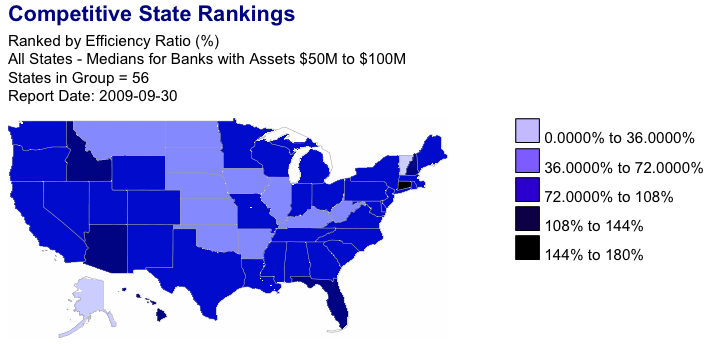 | |
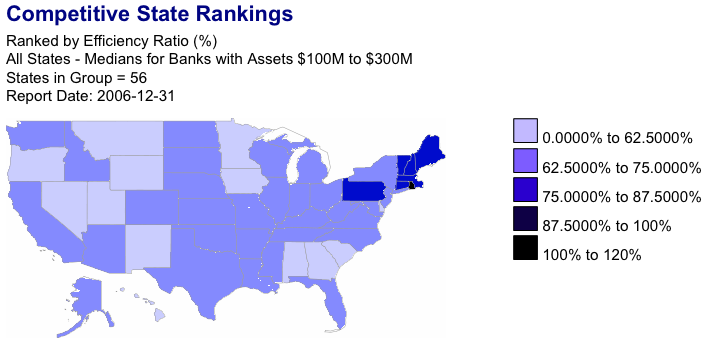 | 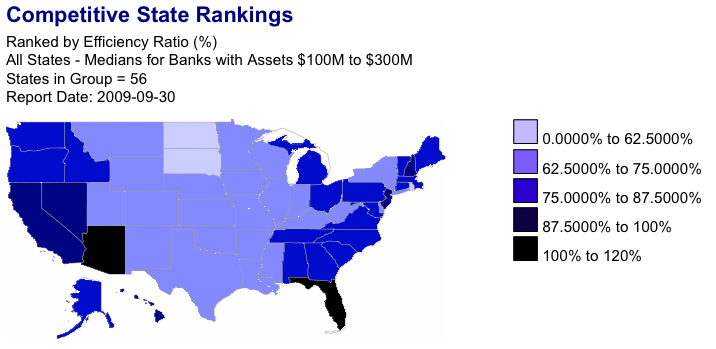 | ||
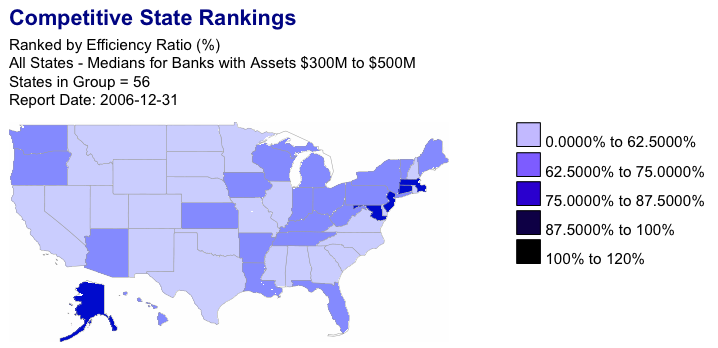 | 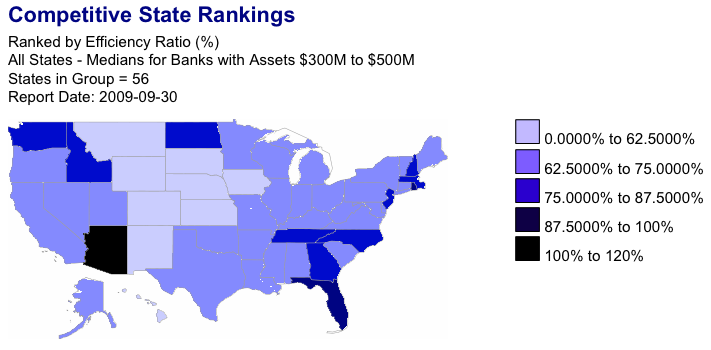 | ||
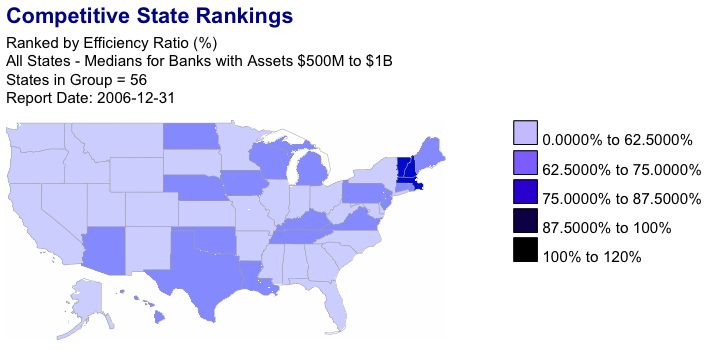 | 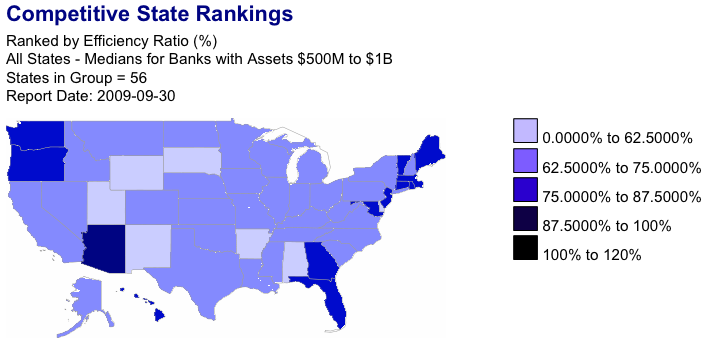 | ||
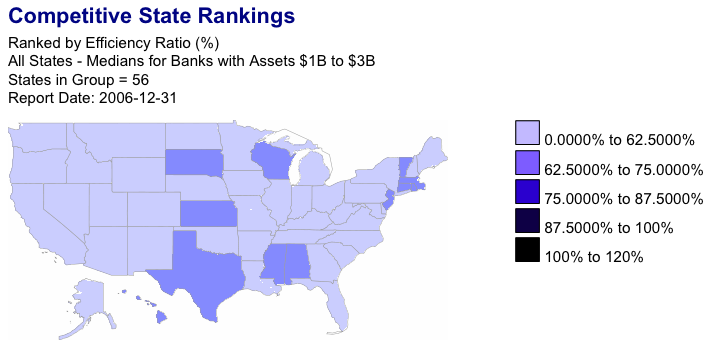 | 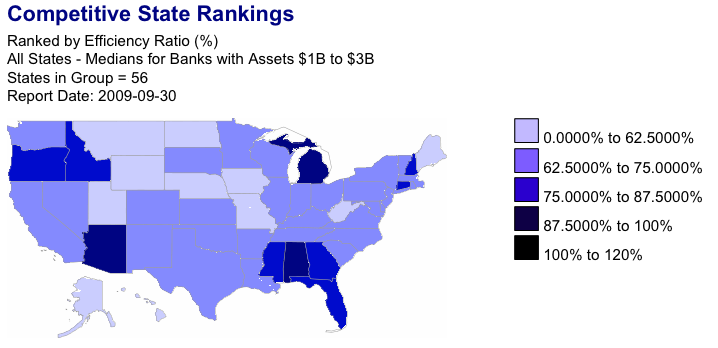 | ||
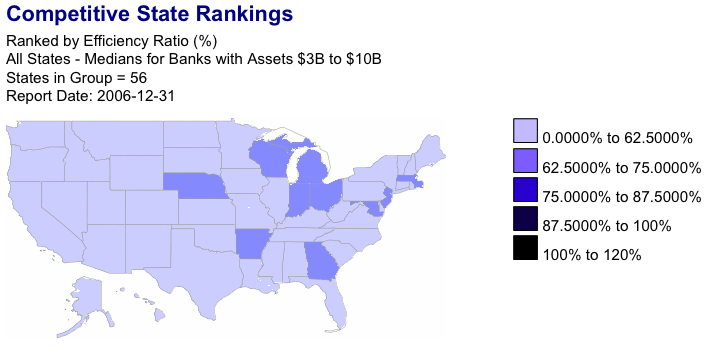 | 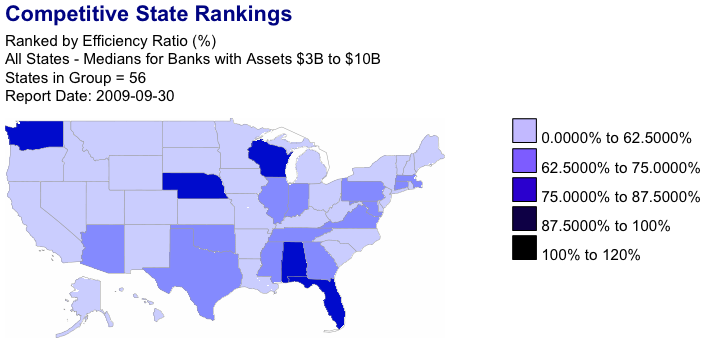 | ||
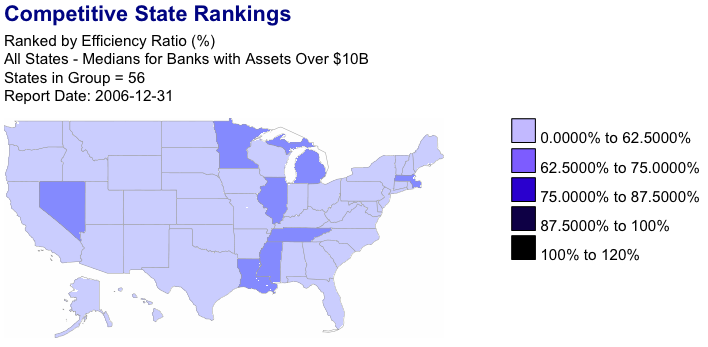 | 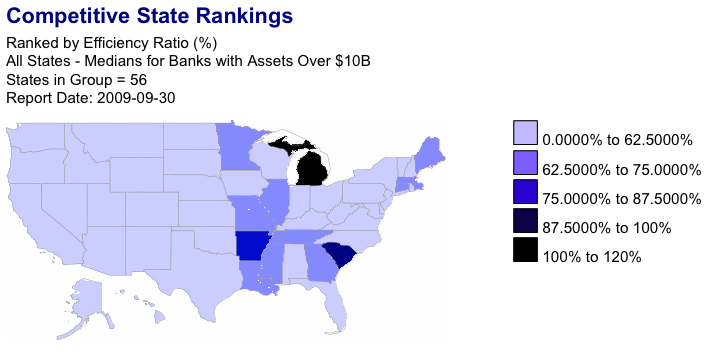 | ||
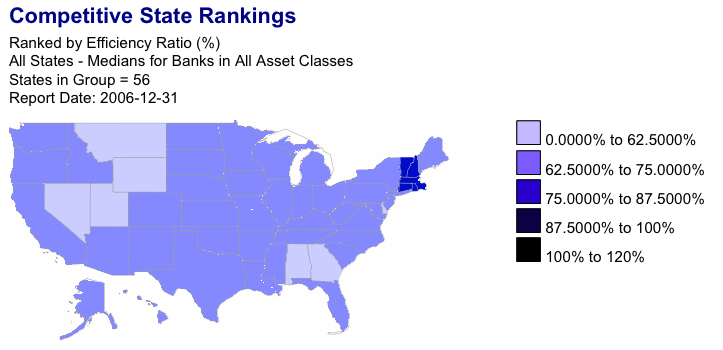 | 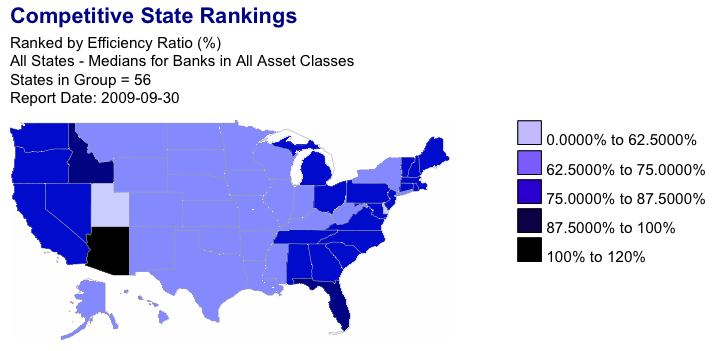 |
Longer-Term Evolution of Median Efficiency Ratio
Posted on Fri Dec 18, 2009Following up on our post from yesterday, we highlighted the Median Efficiency Ratio across states in the US on a more granular timescale. From the following images, we can see how the economic, market, and regulatory factors have affected the Median Efficiency Metric of all banks across each state annually over the past several years.
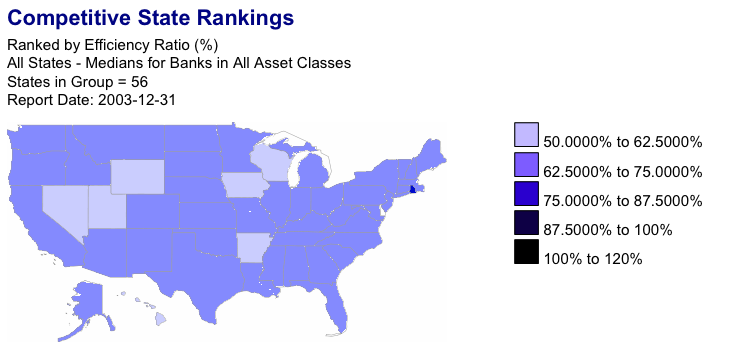 |
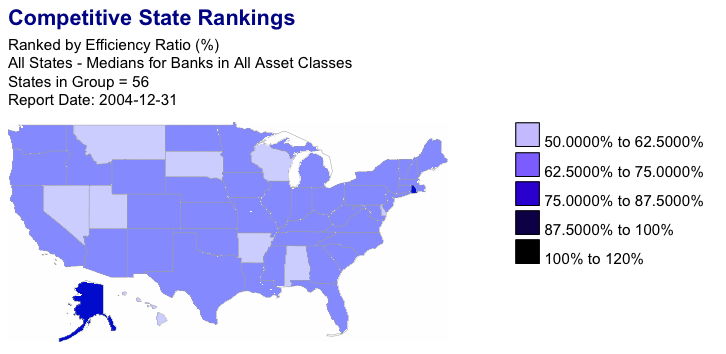 |
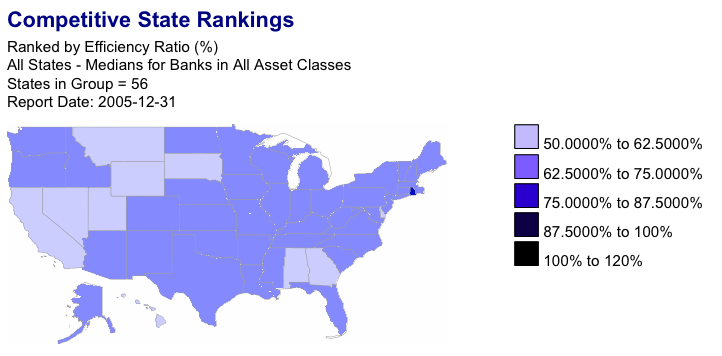 |
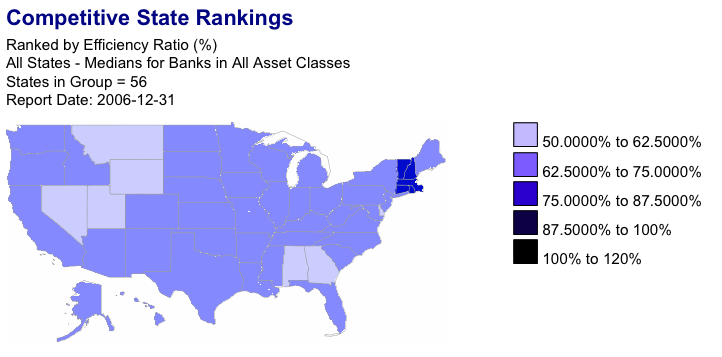 |
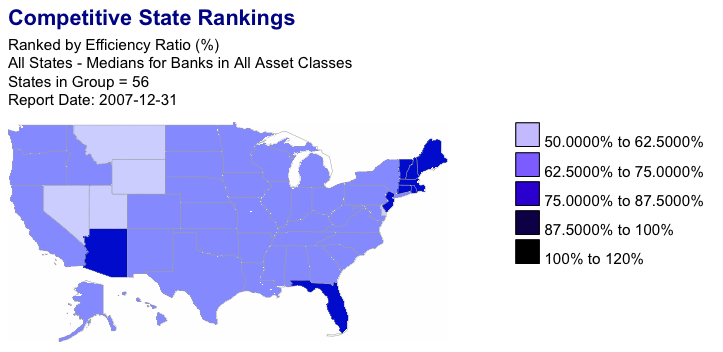 |
 |
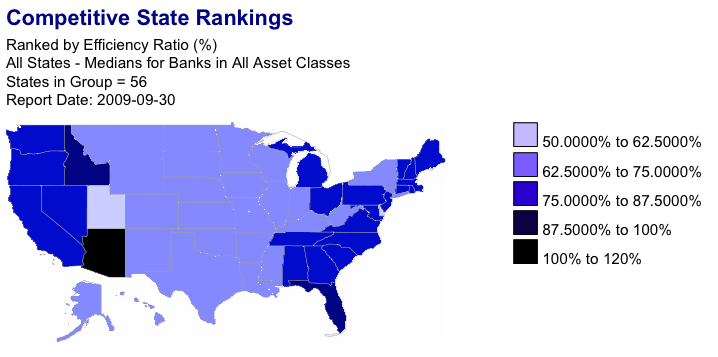 |
Evolution of Median Efficiency Ratio
Posted on Thu Dec 17, 2009In a previous post, we highlighted the Median Efficiency Ratio across states in the US. Take a look at the following images that show how the economic, market, and regulatory factors have changed this metric over the past two years.
 |
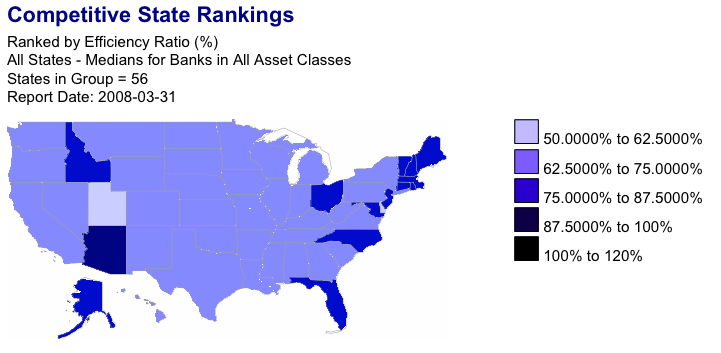 |
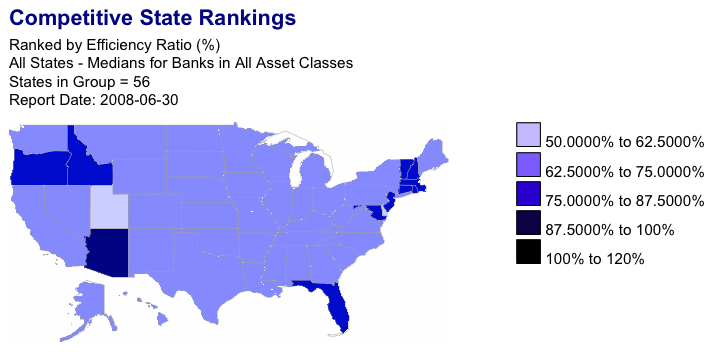 |
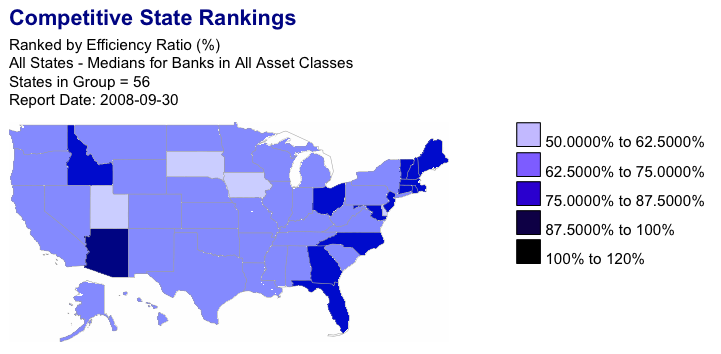 |
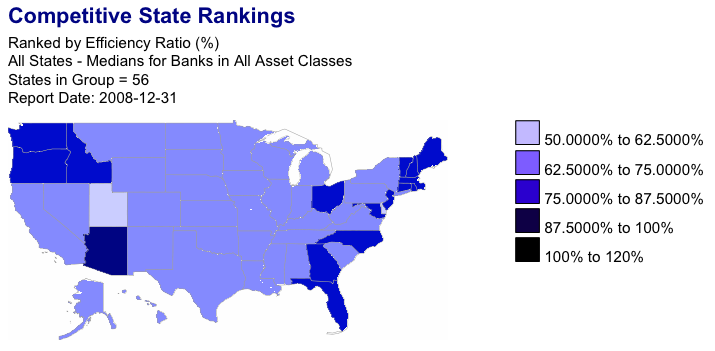 |
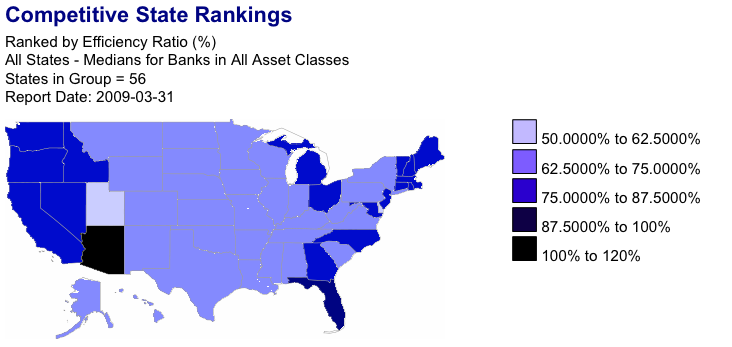 |
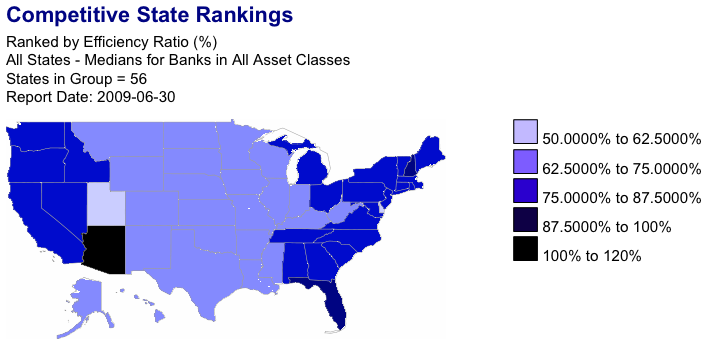 |
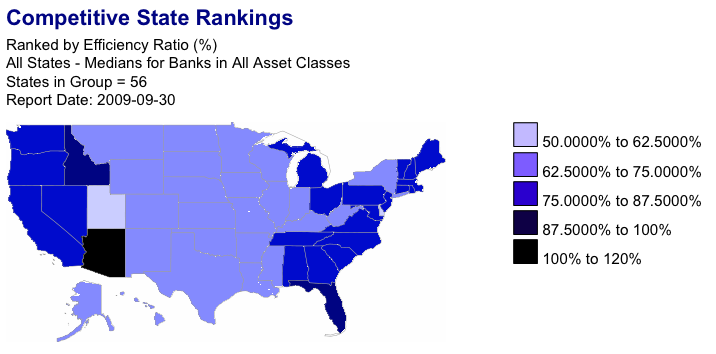 |
Michigan and Nevada MSAs by Median Household Income
Posted on Wed Dec 16, 2009Completing our series (see here for our most recent post), we extend our visibility outside of the Southeastern U.S.; the following tables show the Median Household Income for MSAs in the states of Michigan and Nevada at the end of August 2008, December 2008, and August 2009, respectively. In Michigan, over the past year, these tables show an average increase in the number of households per MSA of 0.19% and an average increase in the median household income of 2.37% per MSA. (Since the start of 2009, we see the respective average increases in the number of households per MSA and median household income per MSA of 0.12% and 1.56%, respectively.) The Saginaw-Bay City-Midland, MI; Flint; Adrian; and Owosso MSAs experienced a drop in its median household income over the 12 month period from August 2008 to August 2009 (0.587%, 0.131%, 0.066%, and 0.014% declines, respectively). On the other hand, Big Rapids (6.54%), Marquette (4.88%), Ann Arbor (4.48%), Houghton (4.17%), and Allegan (4.00%) showed surprising growth in their respective median household income figures. Over that 12 month period, Michigan saw slight declines in the number of households in Alma (0.16% decline), Owosso (0.11% decline), Sturgis (0.06% decline), and Flint (0.05% decline), and the strongest growth was in Holland-Grand Haven (0.76% increase), Traverse City (0.59% increase), Monroe (0.47% increase), Allegan (0.42% increase), and Kalamazoo-Battle Creek (0.41% increase). Notice that the aggregation of these urban areas showed a cumulative increase in the number of households between August 2008 to August 2009 from 3.996M to 4.001M households (an increase of 0.14%), whereas the state of Michigan showed an increase in households from 4.536M to 4.543M (a change of 6,436 households), and an increase in its median annual household income from $46,451 to $46,901, an increase of 0.97%. Nevada, on the other hand, has seen an average increase in the number of households by 0.67% per MSA, an average increase in the median household income of 3.92% per MSA, over the 12 month window. (This number is the average of the changes for each of the identified MSAs over the 12 month period from August 31, 2008 to August 31, 2009. Since the start of 2009, we see an average increase in the median household income of 2.57% per MSA across Nevada, and an average 0.44% increase in the number of households.) Growth in the median household income over the 12 month period has been almost consistently positive, with the only decline seen in Pahrump (-0.26%); increases peak in Gardnerville Ranchos (6.11%), Elko (5.12%), and Las Vegas (4.67%). Nevada generally witnessed growth over the period, with only Pahrump and Carson City showing very slight declines in the number of households (0.57% and 0.02% declines, respectively). Otherwise, the most significant increases in the number of households in Nevada were in Las Vegas (2.76% increase), and Reno (0.94%). Notice that the aggregation of these urban areas showed a cumulative increase in the number of households between August 2008 to August 2009 from 1.090M to 1.114M households (an increase of 2.24%), whereas the state of Nevada showed an increase in households from 1.131M to 1.155M (a change of 24,684 households), and an increase in its average annual household income from $55,396 to $57,221, a rise of 3.29%. Also, it should be noted that the consumer price index went from 218.783 at the end of August 2008, to 211.143 at year-end 2008, to 215.969 at the end of August 2009 (a 2.286% increase during 2009, but a 1.286% decrease over the 12 month period).
The following table lists the MSAs in Tennessee and North Carolina, sorted by Median Household Income as of August 2008, year-end 2008, and August 2009.
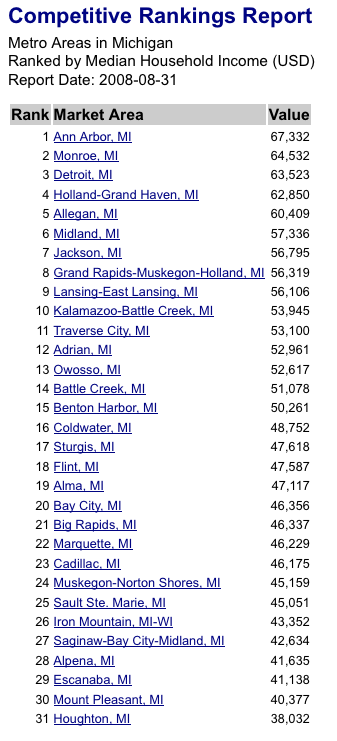 |
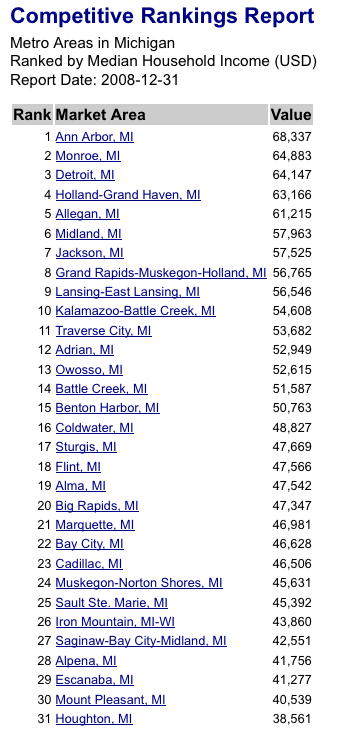 |
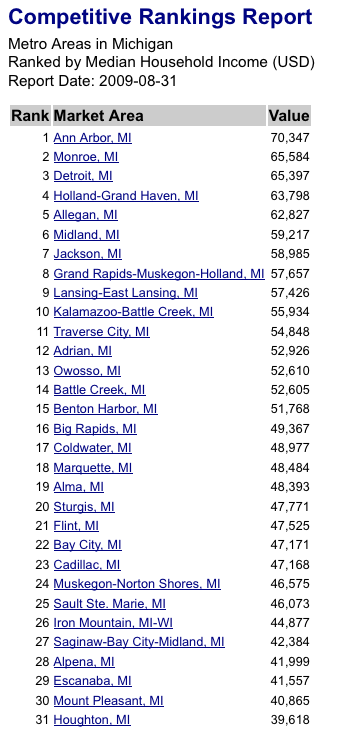 |
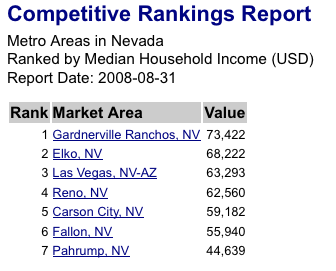 |
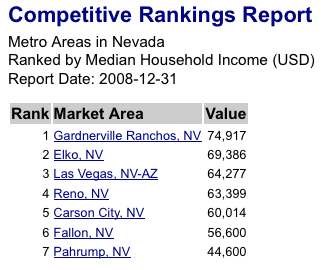 |
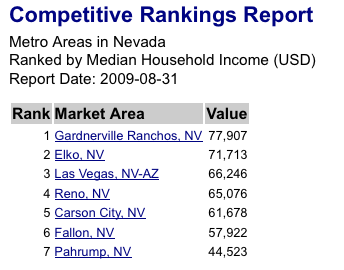 |
3Q09 FDIC Data Available
Posted on Tue Dec 15, 2009We have uploaded the most recent banking industry data available. Please feel free to review the data as convenient for you.
Tennessee and North Carolina MSAs by Median Household Income
Posted on Mon Dec 14, 2009Continuing our series, the following tables show the Household Income for MSAs in the states of Tennessee and North Carolina at the end of August 2008, December 2008, and August 2009, respectively. In Tennessee, over the past year, these tables show an average increase in the number of households per MSA of 0.88% and an average increase in the median household income of 3.08% per MSA. (Since the start of 2009, we see the respective average increases in the number of households per MSA and median household income per MSA of 0.58% and 2.02%, respectively.) Only the Columbia, TN MSA experienced a drop in its median household income over the 12 month period from August 2008 to August 2009 (8.59% decline). On the other hand, La Follette (9.22%), Union City (6.20%), and Brownsville (4.82%) showed significant growth in their respective median household income figures. Over that 12 month period, Mississippi saw growth in all of its MSAs in the number of households, varying from Union City (0.05%), Lawrenceburg (0.17%), Newport (0.21%), and Paris (0.22%), to Columbia (2.1%), Nashville (1.96%), and the Clarksville-Hopkinsville area (1.89%). Notice that the aggregation of these urban areas showed a cumulative increase in the number of households between August 2008 to August 2009 from 2.737M to 2.773M households (an increase of 1.32%), whereas the state of Tennessee showed an increase in households from 2.764M to 2.797M (a change of 33,451 households), and an increase in its average annual household income from $42,586 to $42,932, an increase of 0.81%. North Carolina, on the other hand, has seen an average increase in the number of households by 1.27% per MSA, an average increase in the median household income of 3.23% per MSA, over the 12 month window. (This number is the average of the changes for each of the identified MSAs over the 12 month period from August 31, 2008 to August 31, 2009. Since the start of 2009, we see an average increase in the median household income of 2.13% per MSA across North Carolina, and an average 0.84% increase in the number of households.) Growth in the median household income over the 12 month period has been almost consistently positive, with the only decline seen in North Wilkesboro (-1.23%); increases peak in Jacksonville (8.16%), New Bern (6.04%), and Morehead City (5.15%). NC saw substantial growth over the period, with only Kinston showing a very slight decline in the number of households (0.03% decline). Otherwise, the most significant increases in the number of households in North Carolina were in Statesville-Mooresville (4.31% increase), the Triangle area (Raleigh-Durham-Chapel Hill, 3.49%), Charlotte-Gastonia-Rock Hill (2.95%), Greenville (2.77%), and Wilmington (2.72%). Notice that the aggregation of these urban areas showed a cumulative increase in the number of households between August 2008 to August 2009 from 3.918M to 3.994M households (an increase of 1.27%), whereas the state of North Carolina showed an increase in households from 4.214M to 4.290M (a change of 75,651 households), and an increase in its average annual household income from $41,651 to $41,952, a rise of 0.72%. Also, it should be noted that the consumer price index went from 218.783 at the end of August 2008, to 211.143 at year-end 2008, to 215.969 at the end of August 2009 (a 2.286% increase during 2009, but a 1.286% decrease over the 12 month period).
The following table lists the MSAs in Tennessee and North Carolina, sorted by Median Household Income as of August 2008, year-end 2008, and August 2009.
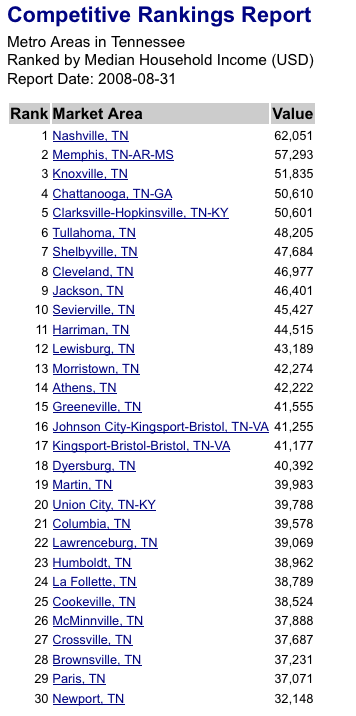 |
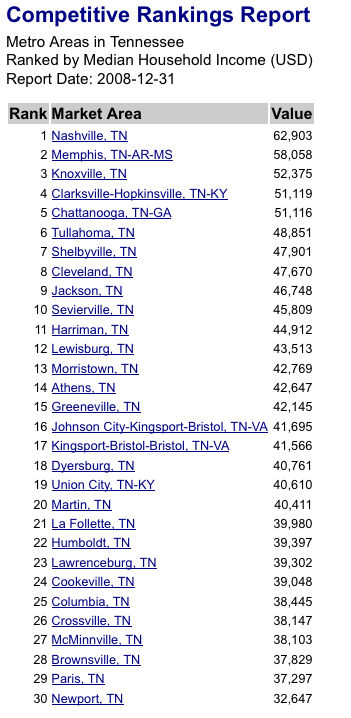 |
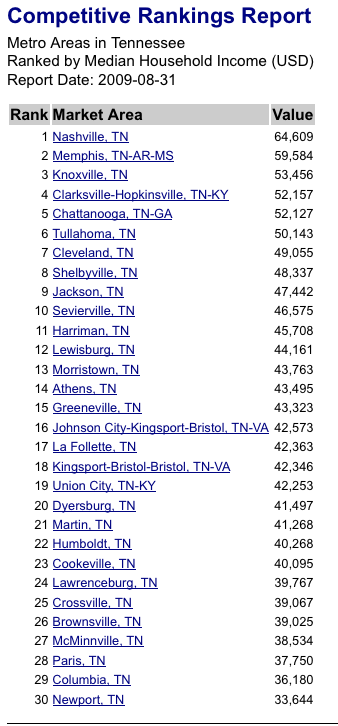 |
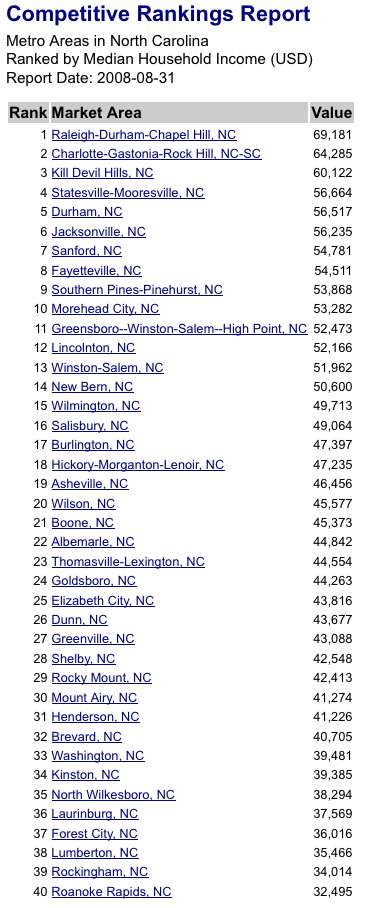 |
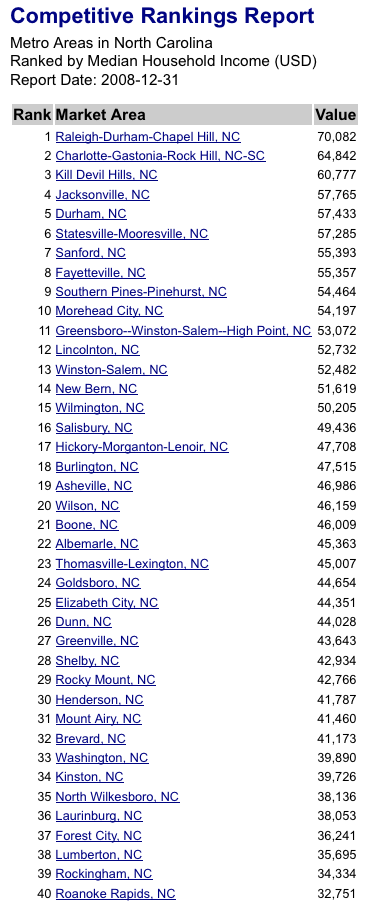 |
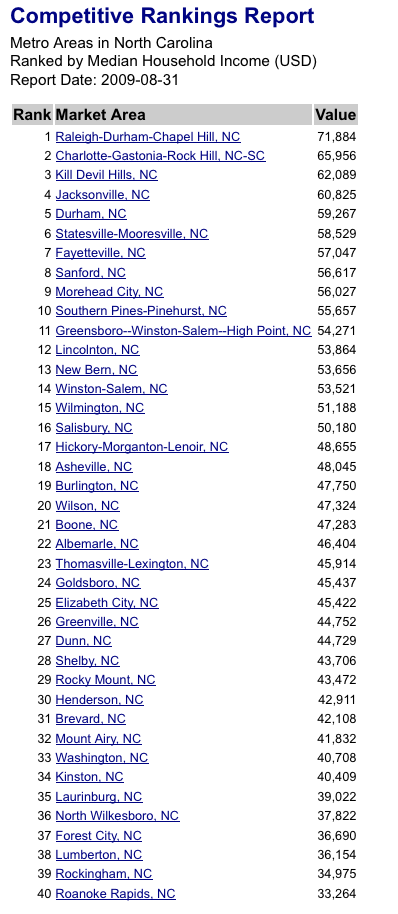 |
Mississippi and Georgia MSAs by Median Household Income
Posted on Sun Dec 13, 2009To compare with our previous post, the following tables show the Household Income for MSAs in the states of Mississippi and Georgia at the end of August 2008, December 2008, and August 2009, respectively. In Mississippi, over the past year, these tables show an average increase in the number of households per MSA of 0.79% and an average increase in the median household income of 3.21% per MSA. (Since the start of 2009, we see an average increase in the number of households per MSA of 1.19% and an increase in the median household income of 2.11% per MSA.) Changes in the median household income over the year has varied from a decrease of 1.5% in Brookhaven, and 1.4% in Grenada; to increases in Oxford (4.05%), Meridian (4.16%), Laurel (4.28%), Starkville (5.46%), Pascagoula (6.21%), Columbus (6.27%), Cleveland (6.73%), and Indianola (6.73%). Over the 12 month period, Mississippi saw growth in all of its MSAs in the number of households, varying from Clarksdale (0.26%), Greenwood (0.26%), Corinth (0.31%), Indianola (0.34%), and Greenville (0.37%), to Starkville (3.2%), and Biloxi-Gulfport (5.1%). Notice that the aggregation of these urban areas showed a cumulative increase in the number of households between August 2008 to August 2009 from 901,898 to 917,251 households (an increase of 1.70%), whereas the state of Mississippi showed an increase in households from 1.270M to 1.290M (a change of 19,280 households), and a decline in its average annual household income from $33411 to $32886, a drop of 1.57%. Georgia, on the other hand, has seen an average increase in the number of households by 1.09% per MSA, an average increase in the median household income of 3.25% per MSA. (This number is the average of the changes for each of the identified MSAs over the 12 month period from August 31, 2008 to August 31, 2009; the Atlanta MSA, which contains a significant portion of the population of Georgia, showed a growth rate of 3.671% in median household income. Since the start of 2009, we see an average increase in the median household income of 2.14% per MSA across Georgia, and an average 0.72% increase in the number of households.) Growth in the median household income over the 12 month period has been consistently positive with increases ranging from Fitzgerald (1.04%), Cedartown (1.51%), Macon (1.62%), Gainesville (1.63%), and Brunswick (1.66%), to Moultrie (6.56%), Thomasville (5.80%), Fort Valley (5.69%), and Columbus (5.22%). Georgia saw substantial growth over the period, with only Vidalia showing a very slight decline in the number of households (0.01% decline). Otherwise, the most significant increases in the number of households in Georgia were in Statesboro (2.16% increase), Warner Robins (1.96%), Valdosta (1.92%), and the Hinesville-Fort Stewart area (1.92%). Notice that the aggregation of these urban areas showed a cumulative increase in the number of households between August 2008 to August 2009 from 3.682M to 3.741M households (an increase of 1.60%), whereas the state of Georgia showed an increase in households from 4.036M to 4.098M (a change of 61,730 households), and a decline in its average annual household income from $48640 to $48330, a drop of 0.64%. Also, it should be noted that the consumer price index went from 218.783 at the end of August 2008, to 211.143 at year-end 2008, to 215.969 at the end of August 2009 (a 2.286% increase during 2009, but a 1.286% decrease over the 12 month period).
The following table lists the MSAs in Mississippi and Georgia, sorted by Median Household Income as of August 2008, year-end 2008, and August 2009.
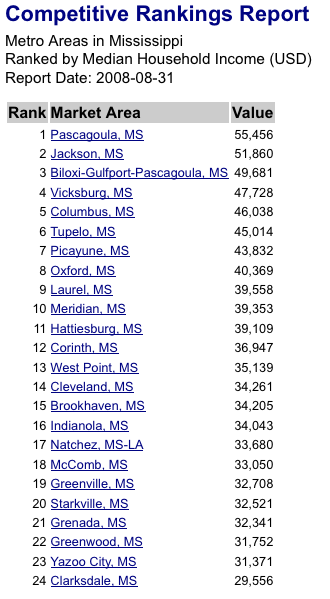 |
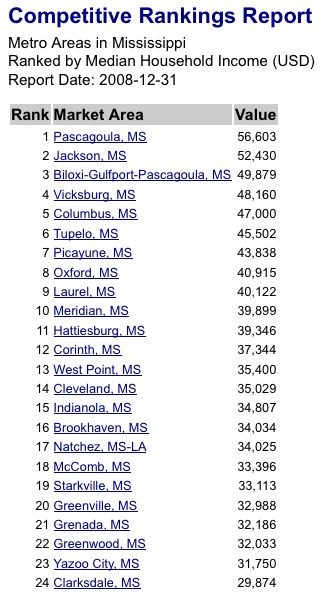 |
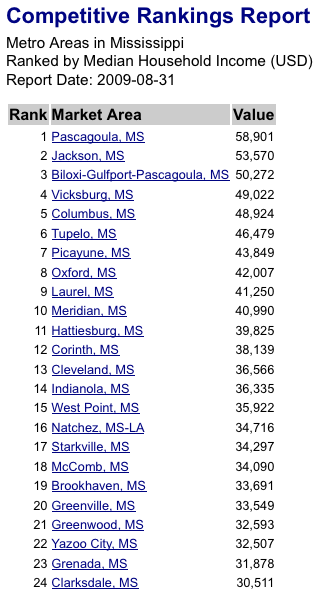 |
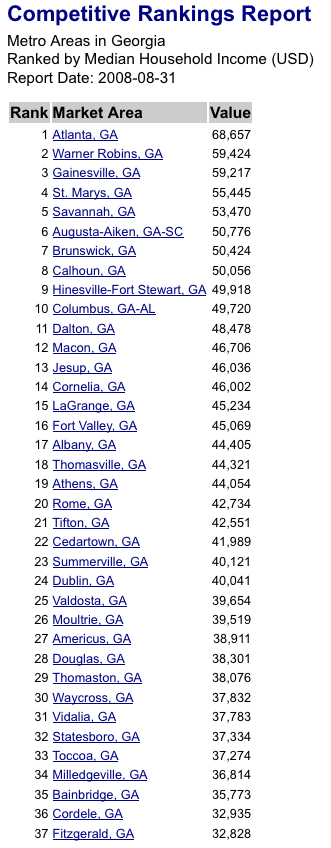 |
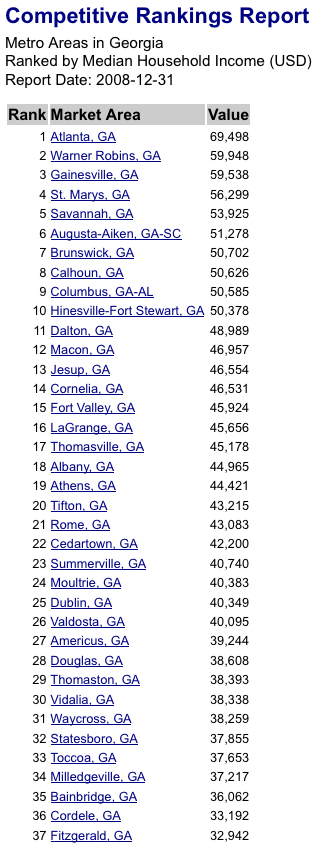 |
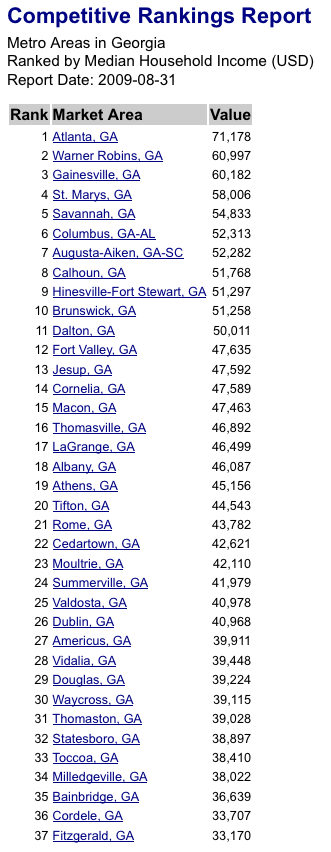 |
Alabama MSAs by Household Income
Posted on Sat Dec 12, 2009The following tables show the Household Income for MSAs in the state of Alabama at the end of August 2008, December 2008, and August 2009. Over the past year, these tables show an average increase in the number of households of 0.895% per MSA, and an average increase in the median household income of 3.29% per MSA. (Since the start of 2009, we see an average increase in the number of households of 0.59% and an average increase in the median household income of 2.16% per MSA.) Growth over the year has varied from 1.7% in Scottsboro; 2.0% in Mobile; and 1.0% in Valley, to over 4% in Birmingham (4.4%); Anniston (5.5%); Enterprise-Ozark (4.1%); Gadsden (4.4%); Albertville (4.3%); Troy (4.6%); Eufala (4.7%); and Tuskegee (4.1%). Notice that the aggregation of these urban areas showed a cumulative increase in the number of households between August 2008 to August 2009 from 1.896M to 1.916M households (an increase of 1.08%). Interestingly, while all of the noted MSAs showed positive growth over the period, the state of Alabama showed an overall increase in the number of households by just under 1% (from 2.163M to 2.182M) and a decline in its average annual household income from $36939 to $36496, a drop of 1.2%. Also, it should be noted that the consumer price index went from 218.783 at the end of August 2008, to 211.143 at year-end 2008, to 215.969 at the end of August 2009.
The following table lists the MSAs in Alabama, sorted by estimated Household Income as of August 2008, year-end 2008, and August 2009.
|
|
|
2009 Summary of Deposit Data Imported
Posted on Sun Oct 18, 2009We are pleased to report that the 2009 Summary of Deposit information from the FDIC has been imported into Capitalytics' databases. Please contact us with any feature requests.
Birmingham Business Journal Article
Posted on Mon Sep 21, 2009The Birmingham Business Journal has posted an article about deposits in Birmingham, AL based on Capitalytics' Market Analysis for the Birmingham-Hoover, AL MSA. Please contact us if you have any questions about this information, or if you would like information about your area.
Email Alerts for Bank Attributes
Posted on Fri Aug 28, 2009We are pleased to announce the Capitalytics site's latest feature, "Bank Alerts". Using this feature, users have notifications email'd to them when attributes of any bank(s) change to meet a specified criteria. All attributes that Capitalytics monitors (over 400) from all US banks are supported. Additionally, on the "Manage Alerts" panel, the current state of all configured alerts is presented with a link to the history each alert's attribute. All alerts are re-evaluated nightly.
This feature is the result of a request of our users, and is available under the "Admin" menu, labeled as "Manage Bank Alerts". Please contact us if you have suggestions for features that you would like integrated into the Capitalytics website.
2Q09 FDIC Data Available
Posted on Thu Aug 27, 2009We have uploaded the most recent banking industry data available. Please feel free to review the data as convenient for you.
Analytics Dashboard
Posted on Thu Aug 13, 2009We are pleased to reveal our newly designed Dashboard console, which users may find on our Main page after logging in. Based on the advice of our customers, this format will give our users a concise and unified view into potential regulatory exposures, strengths (compared to competitors), and weaknesses (again, compared to competitors). Our tabbed format also provides for a simple overview that identifies what type and the significance of over 40 potential issues, as well as a bank's key overview metrics.
We welcome feedback on all of our features, and try to be responsive to requests of our customers. Please do not hesitate to contact us with any suggestions or comments regarding Capitalytics.
Roll-out of Market Analyses
Posted on Fri Jul 31, 2009We are proud to announce the release of our new Market Analysis features. Market Ranks, Market Overviews, Advanced Market Reports, and Advanced Market Group Reports -- all of which are comparable to reports under the Bank Analyses tab -- are all currently deployed. We also support reports to help growing banks identify new facilities within identified zip codes, counties, and MSAs; and our Opportunity/Vulnerability report allows for "what-if" analyses to allow speculation of changes in the market share between branch offices within an area. Using these reports, our users can see demographic trends on a monthly basis since before the mid-1990s. Further, we are also supporting Custom Market Groups so that bankers can compare sets of zip codes or counties. Our reports cover ten different attributes including labor force, household income, and deposits across the entire United States, regions, states, counties, and even down to zip codes.
Dr. Mike Hardin Appointed to Advisory Board
Posted on Tue Jul 21, 2009Capitalytics, LLC, a national provider of analytic solutions for community banks, announces that Dr. J. Michael Hardin has been appointed to the company’s Advisory Board, effective July 2009.
Hardin is the Senior Associate Dean and Associate Dean for Research at the University of Alabama's Culverhouse College of Commerce and Business Administration. He serves as Director for the Institute of Business Intelligence through Culverhouse College of Commerce and also as Director of Data Analysis and Data Management through The Center for Mental Health and Aging, both at The University of Alabama. In addition, Hardin is an Adjunct Professor of Biostatistics, Computer Science and Health Information at The University of Alabama at Birmingham, and serves on the Board of Directors of Alabama Quality Assurance Foundation, LLC.
“Dr. Hardin is a highly-lauded and well-respected member of our local and national community. He has served as a statistical consultant to numerous governmental entities, including the Department of Health and Human Services and the National Institute of Health,” explained Bill McKinnon, CEO of Capitalytics. “We are honored to have an individual of his professional stature on our Advisory Board and helping to direct Capitalytics’ new product offerings. Dr. Hardin’s research background and his extensive business relationships will be extremely helpful as our company grows.”
Capitalytics, based in Birmingham, AL, provides business intelligence and automated analytics to community banks across America. By providing cost-effective analysis of public and proprietary information, Capitalytics helps community banks reduce risks, mitigate losses due to non-performing assets, and put more capital to use.
“With its web-based service offerings, Capitalytics is focused on integrating information and solving tactical problems that have strategic impact for community banks across the country,” explained Hardin. “I’m looking forward to working with Capitalytics to bring innovative services to the banking industry. Together, we anticipate being able to leverage available data and information to help community banks that are positioned and ready to grow over the course of the next several years.”
Capitalytics provides information to community banks, helping them determine strategic direction and anticipate performance, through the use of reports that cover historical and forecasted values for over 200 metrics. Using public information, Capitalytics provides reports that reflect valuable statistics for individual banks and groups of banks. Capitalytics also offers augmented services, based on proprietary data provided by individual clients, including data mining, enterprise risk management, and credit profile generation.
Hardware Upgrade for capitalytics.com
Posted on Thu Jul 09, 2009Over the past week, capitalytics.com has undergone a hardware upgrade to improve response time for reports, as well as to handle an increasing user load. A few simple comparisons between the old hardware and the new hardware indicate that the new hardware provides a performance boost of 2x to 7x compared with the old hardware, depending on the specific report. In particular, Asset Performance Reports, Liquidity Reports, Advanced Bank Reports, and Advanced Market Reports now render significantly faster than they did previously.
Initial Roll-out of Market Analysis Features
Posted on Wed Jun 24, 2009We are proud to announce the initial set of Market Analysis features. Market Ranks, Market Overviews, and Advanced Market Reports -- all of which are comparable to reports under the Bank Analyses tab -- are all currently deployed. These reports are actively undergoing optimizations in order to maintain our users' experience. Using these reports, our users can see demographic trends on a monthly basis since before the mid-1990s. Our reports cover ten different attributes including labor force, household income, and deposits across the entire United States, regions, states, counties, and even down to zip codes.
1Q09 FDIC Data Available
Posted on Wed May 27, 2009We have uploaded the most recent banking industry data available. Please feel free to review the data as convenient for you.
Suggested Peer Groups
Posted on Wed May 06, 2009For our users who are registered with a community bank, Capitalytics now provides for "Suggested Peer Groups". With this new feature, our users can now populate a new peer group with all comparable banks in our database. To access this feature, a user can click on the "Admin" tab at the top of the page, and then select "Manage Custom Bank Group", followed by "Create New Custom Bank Group".
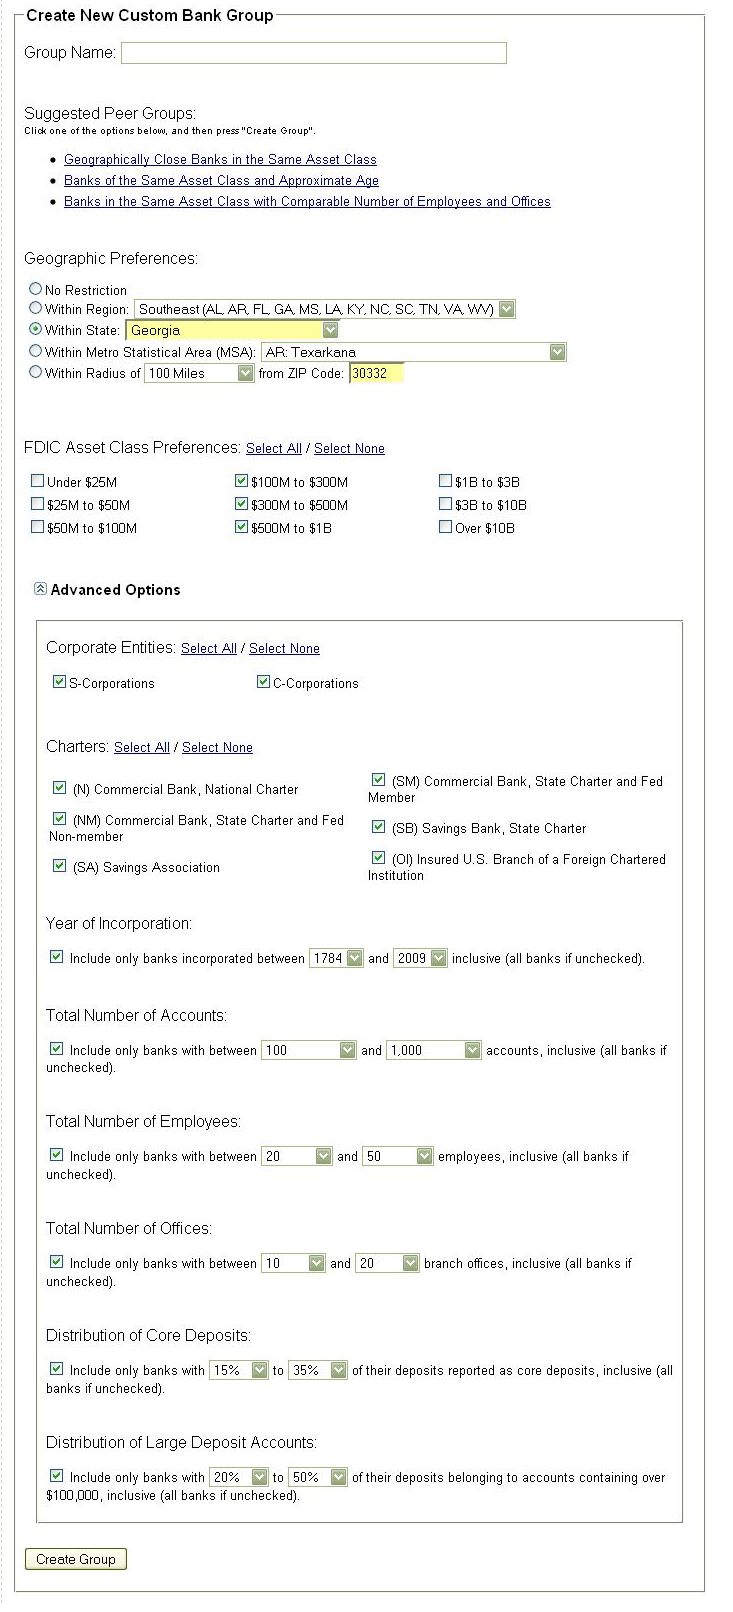
Users should notice that the peer group that is created by clicking on one of the links at the top of the panel, followed by "Create Group" at the bottom of the panel, is a static set of banks. While the peer group does not automatically update itself as new information is found about a set of peers, the group can be easily have banks added or removed, or it can be completely re-populated at any time.
Market Indicators for Banking Metrics
Posted on Mon Apr 20, 2009Capitalytics is proud to announce a new feature to our recently unveiled "Executive Summary": Capitalytics system will now scan market metrics to identify which, if any, can be used as a potential indicator of either deposit levels or late assets. In the event that the past performance of one of these banking metrics correlates strongly (either positively or negatively) with one of the market metrics that we scan (e.g., CPI level, etc.), a message like the following is presented in the bank's Executive Summary.
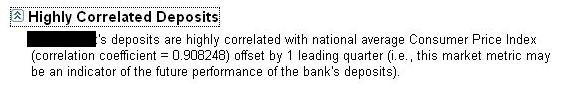
|
At this time, reports will only be noted if the banking metric is correlated with the market metric by more than 80% (i.e., if the correlation coefficient of the two metrics' time series, assuming the indicated lag of 1 to 4 quarters, is greater than 0.8 or less than -0.8).
Executive Summaries
Posted on Wed Apr 08, 2009For our users who are registered as being associated with a bank, Capitalytics now provides an "Executive Summary" immediately upon logging in. As part of the Executive Summary, over 30 indicators of a bank's health are checked. These indicators are both objective thresholds that have been found to be useful industry-wide benchmarks, as well as relative market position metrics. Based on these indicators, appropriate messages are generated, guiding the user through Capitalytics reports in increasing levels of detail to explain how and why a condition came to pass, as well as actions for affecting the issue.
Obviously, every bank's objectives and criteria are different. If your bank would like for Capitalytics to implement a custom set of indicators, please contact us to discuss your situation and what we can do for you.
Charge-offs
Posted on Fri Mar 27, 2009While it is likely no surprise given what is become pervasive in the banking industry, it is interesting to wonder what the factors are that influence an aggregate metric such as that shown here on a scale as large as several states (in this case, Colorado, Montana, Idaho, Wyoming, and Utah).
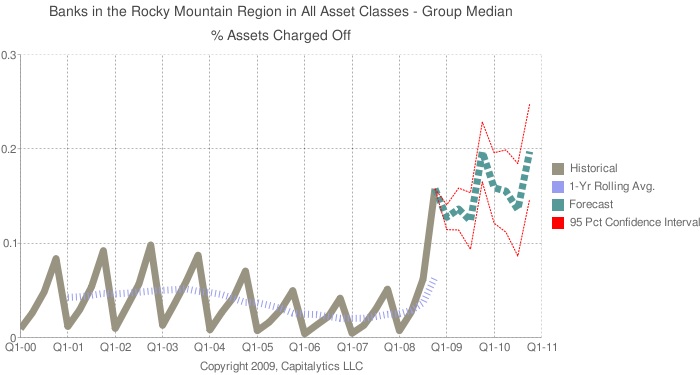
New Front Pages
Posted on Fri Feb 27, 2009To give new users of the Capitalytics service a better, more concrete idea of the services that we provide, we have reworked our "Home" and "About" pages. If you have any comments, please let us know -- regarding the page, look-and-feel, usability, or new features.
4Q08 Data Available
Posted on Thu Feb 26, 2009We have uploaded the most recent banking industry data available. Please feel free to review the data as convenient for you.
The Effects of Culture on Banking Practices
Posted on Mon Feb 23, 2009One of the key premises of Capitalytics' analysis processes is that the culture of a community that a bank serves (along with its own policies and procedures) is intrinsically related to the performance of the bank. In the following images, we took several MSAs, and determined the median value for the "% Assets Charged Off" (per quarter) across all banks based on those areas.
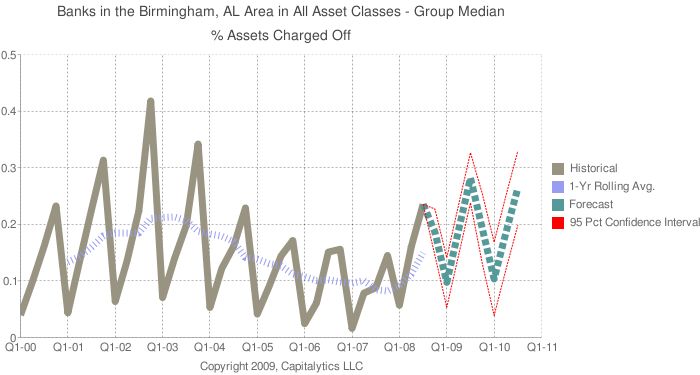 |
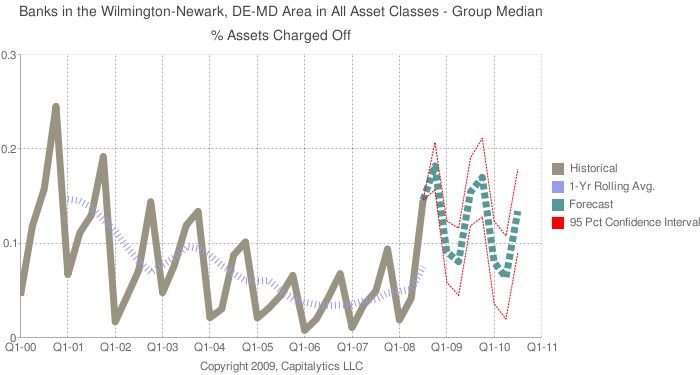 |
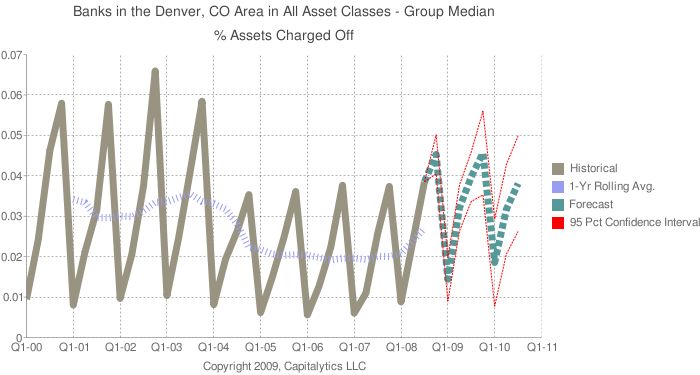 |
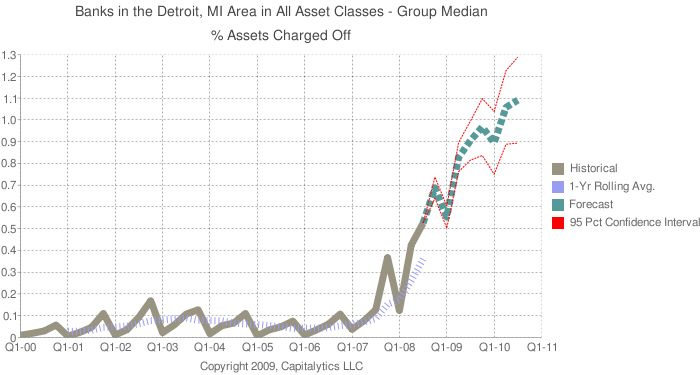 |
In the first two images, we see that the median amount that banks in Birmingham, AL and Wilmington, DE charge off between 0.8% and 1.5% of their assets per quarter. The median value for banks based in Denver, CO is approximately 0.28%. However, the median value for banks based in Detroit, MI is approximately 0.38%. (Notice that during 3Q08, the highest 5 MSAs for this metric were Redding, CA with a median value of 0.957%; Naples, FL with a value of 0.969%; Lawton, OK with a value of 1.13%; Merced, CA with a value of 1.45%; and Pueblo, CO with a value of 2.315%.)
Median Efficiency Ratios per State
Posted on Sat Feb 14, 2009So, inkeeping with our last post, take a look at the following image. This image shows, both as a map and in a table, the median efficiency ratio for banks located in each state in the US.
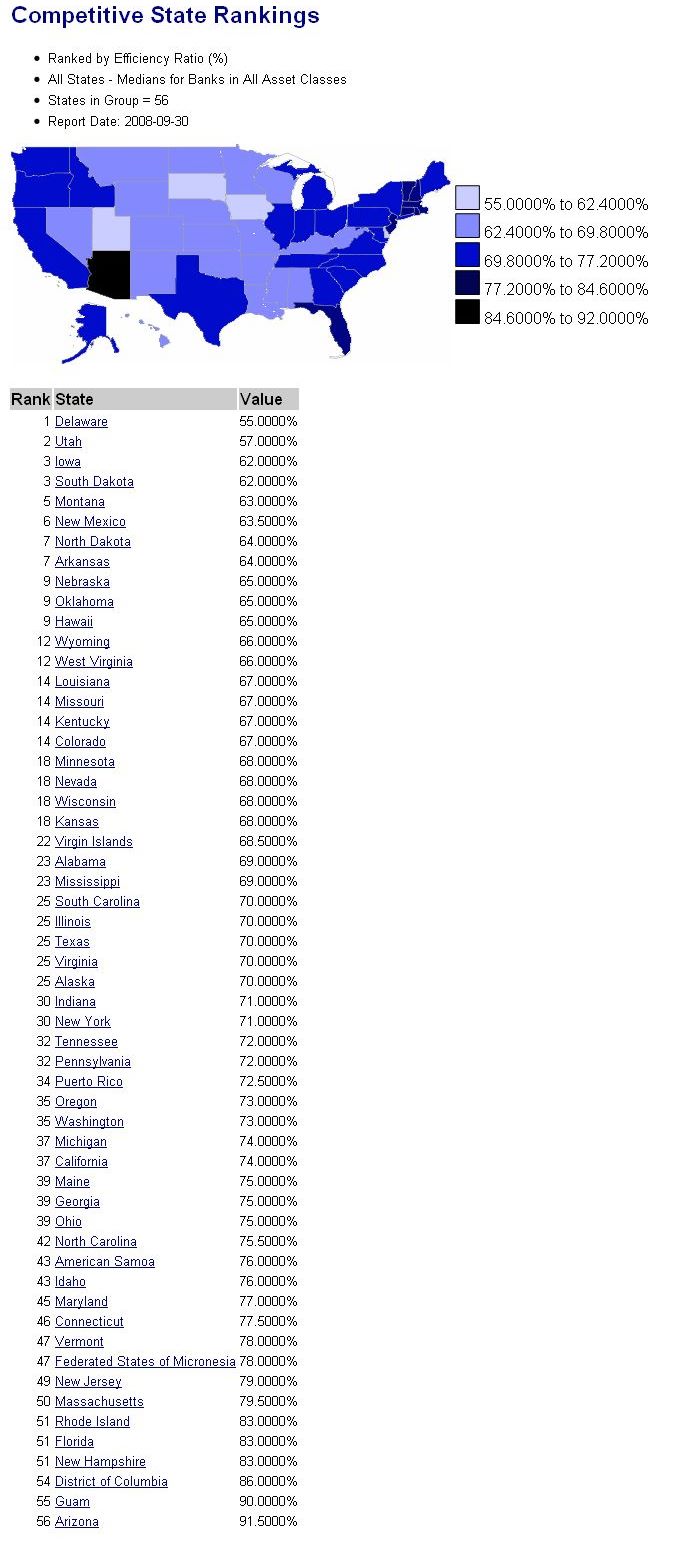
Several folks have asked us about the effects of culture on banking conventions and targets. Obviously, without any statement about the number of banks in each state, and the objectives of those banks, it is not obvious how each number is derived, but this map still provides for some interesting fodder.
Interesting Charts to Come
Posted on Thu Feb 12, 2009Several of our advisors have suggested that we should showcase some of the more interesting (and occasionally provocative) reports as part of a recurring series of blog posts. And that is what we are going to start doing.
For instance, not only does Capitalytics provide data for all 8000+ banks in the United States, we also cover banks in US territories and protectorates. Take a look at the attached image, which ranks all of the banks based outside of the 50 states and DC based on their efficiency ratio. Interestingly, none of these banks show efficiency ratios (generally the ratio of expenses to income) greater than 100%. On the other hand, 892 out of the 8393 (10.6%) banks that reported information to the FDIC in 3Q08 showed efficiency ratios greater than 100%.
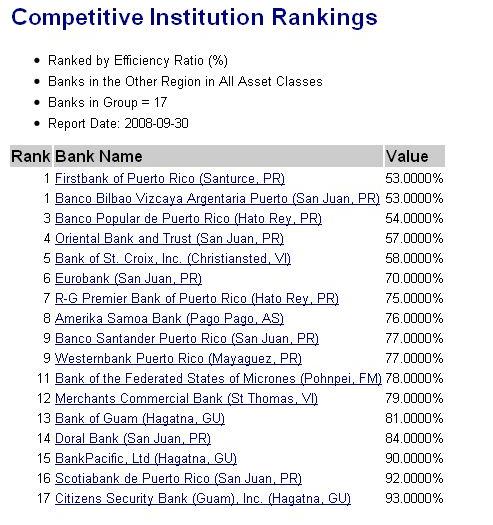
Of course, there are several reasons that a bank may report an efficiency ratio greater than 100%; that, on its face, only means that the expenses for the bank during that quarter exceeded its income, but it is something interesting to note. Contact us if you would like more information like this report.
Where are the Overviews?
Posted on Mon Feb 09, 2009In anticipation of our new Market Analyses, we have re-organized all of the reports that we support under the Bank Analyses tab. We have also added the Bank Synopsis report, and the beginning of our Bank Recommendations. Over the next few days, we will be posting examples of our new reports and giving folks ideas of what sorts of things that we can offer.
Custom Groups
Posted on Sun Jan 25, 2009Again, given feedback from various folks, we have implemented custom groups; you can select groups of banks within specific areas, asset classes, charters, and corporation types, and then use those groups in any of our current reports. Please let us know if there are any other conditions for selecting banks that would be helpful.
Comparative Rankings
Posted on Wed Dec 31, 2008Based on feedback from our users, we have added institutional and regional rankings to the overviews that we implemented a few weeks ago. With these rankings, banks can now see how they compare to their peers within their state, region, and the US; these comparisons are presented in terms of percentiles. Additionally, states and regions are ranked within the nation based on all of the same metrics that are provided. These rankings are available not only for the most recent quarter, but also historically.
Please let us know if you have any other suggestions of features that you would like to see from Capitalytics.
Banking Overview
Posted on Sat Dec 13, 2008Last week, we announced that we had implemented a new set of reports that allow for a "one glance" look at how a bank is performing compared to its peers in its state, its geographic region, and the US. This allows for you to be able to see a set of about 25 normalized metrics (such as assets-to-deposits, percentage of assets charged off, and the ratio of equity capital to liabilities) and gauge how your bank of interest is doing. Over the past few days, we have dramatically improved the performance of these reports, and we are now adding "rankings" so that you can see in what percentile your bank is performing.
Feel free to let us know what else you would like to see as part of Capitalytics. We are looking forward to more feedback.
3Q08 Data Available
Posted on Tue Nov 25, 2008We have uploaded the most recent banking industry data available. Please feel free to review the data as convenient for you.
Also, we would like to thank the efforts of Nate Ritter and Tiny Geo-Coder for providing an invaluable service and being part of the Capitalytics offering. Thanks, Nate!
Historical Reports
Posted on Sat Nov 01, 2008Things have been exciting for the past week or so: we've finished up some features ("historical reports", and a few other things), and started getting some real traction with customers. We've started working with folks to receive custom data from banks and provide custom reports and forecasts. And we're also working on some other novel features.
Keep spreading the word about Capitalytics; thanks for your support!
New "What If" Analyses for Banks
Posted on Fri Oct 24, 2008We're finally rolling out our "what if" analysis engine for banks to be able to see the impact that macro-economic factors like inflation, localized unemployment, and the cost of money will have on their operations. From reports that are generated using our "Advanced Bank Query" option, bankers can select which macro-economic factor (and the amount of change in that factor) in order to see how their forecasts will be affected over the next year.
Please continue to spread the word about Capitalytics, and if you have any suggestions of features!
New "One Click" Report Groups
Posted on Tue Oct 07, 2008We have been working very hard to finish with our latest version of the service. You'll see that we have introduced two sets of "one click" report groups under our "Institution Forecasts" offering -- liquidity analyses and asset performance graphs. With these reports, we illustrate how our customers' deposits are distributed between core/non-core deposits and assets versus liabilities, and we show how their assets are performing (as in what fraction are "to date", late, and written off).
We're now working on the "what if" analysis tool that we've mentioned in the past, and hope to have that feature completed in the next few days. We are also adding several new usability features, and are always looking for new interest and suggestions!
Thanks again for everyone's support and interest in Capitalytics!
Bring on the Press!
Posted on Sun Sep 28, 2008As you know, we are busily working towards our 1.0 release. We're looking to implement our "what if" engine -- that will allow for users to speculate about how any of our reported metrics will respond to changes in economic factors like unemployment and inflation rates -- as well as some "one click" report groups in the next few weeks.
Based on input from some of our initial users, you may have noticed the "Advanced Bank Group Query" that is now available under our "Insitution Forecasts" tab. This Query was implemented to not only allow our users to be able to do some market analysis on specific locales, but also so that our friends in the press can draw on our resources. With this, we are very excited to make our first foray into formally marketing Capitalytics!
Please continue to tell your friends and colleagues about Capitalytics, as we are eager to hear what works and doesn't work for you. Thanks for all of your help and support!
Welcome to Capitalytics!
Posted on Tue Sep 23, 2008Welcome, and thank you for visiting www.capitalytics.com! Stay tuned for future posts as we build this site and add features to it.
|
Subscribe to our blog feed
|
Receive blog updates by email via Feedburner
|